
Welcome to the Experian Thought Leadership Hub
Gain insights into the fast-changing world of consumer and business data through our extensive library of resources.
Gain insights into the fast-changing world of consumer and business data through our extensive library of resources.
434 resultsPage 1
 Report
Read the latest State of Fintech Report to see strategy playbook fintechs are implementing in 2026 and beyond. Key insights include:
 Case Study
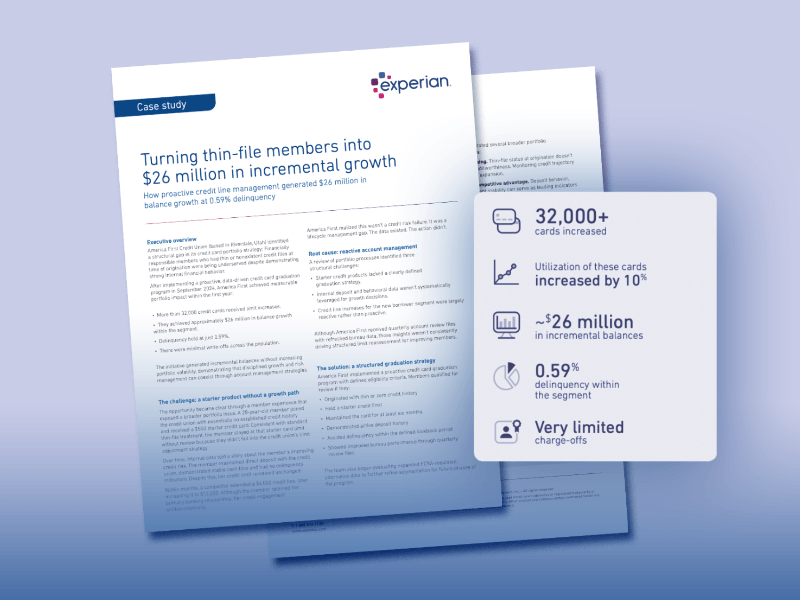
Learn how a proactive credit card graduation strategy helped America First Credit Union responsibly expand member relationships while maintaining strong portfolio performance.
 Webinar
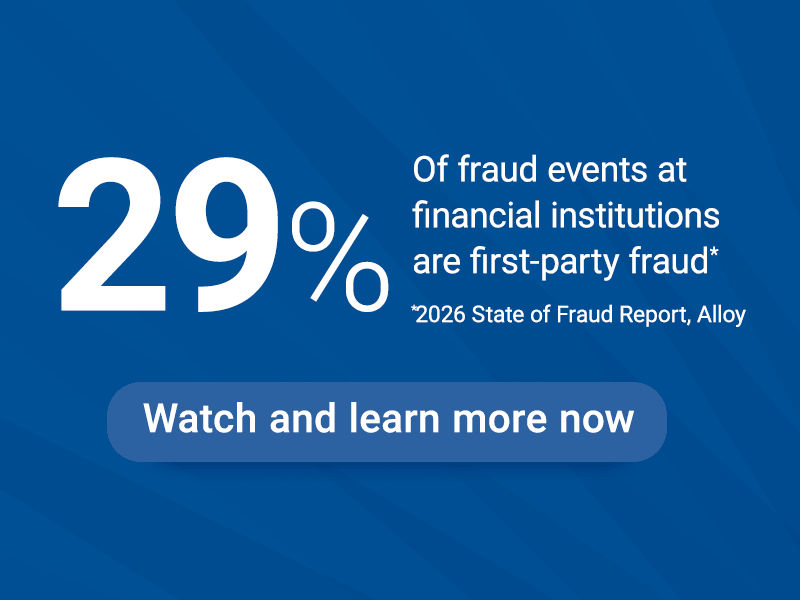
Understand how first-party fraud is changing across financial institutions and what it means for your organization. Learn from Experian experts using industry benchmark data.
 Video
Video
Discover how Ascend Marketing helps marketers activate smarter campaigns with fresh credit data, including:
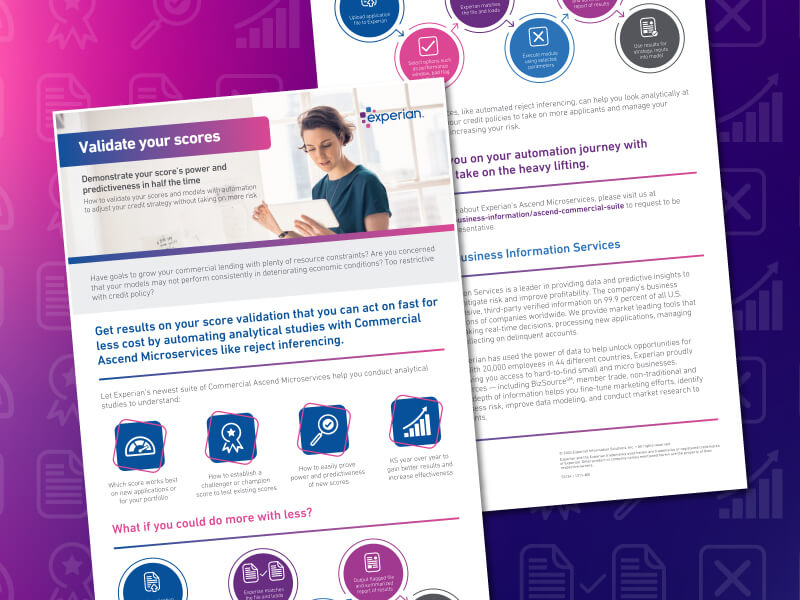
 White Paper
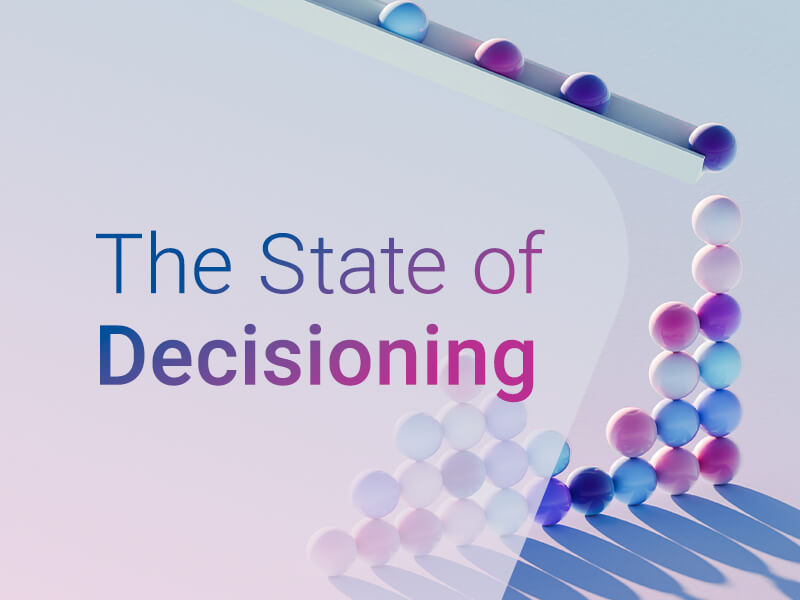
Discover where leading institutions are taking decisioning:
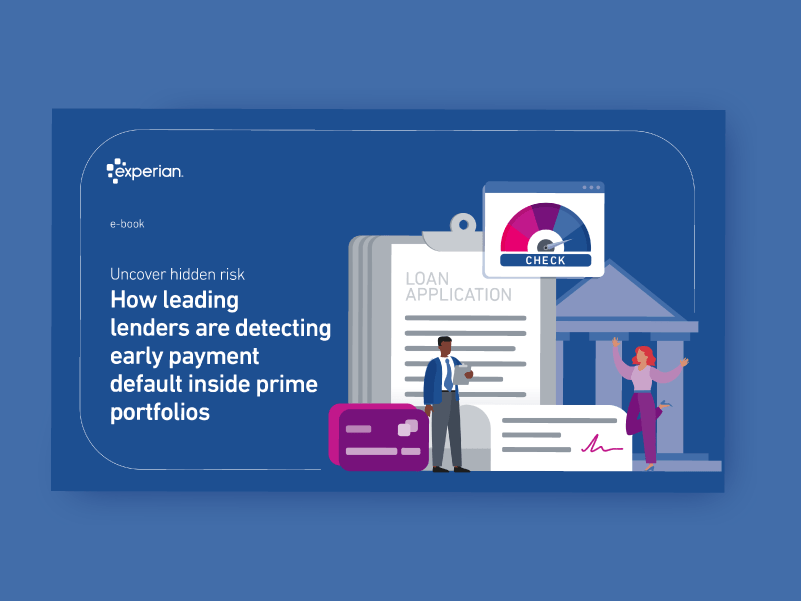 eBook
eBook
Discover how lenders can strengthen prime portfolio performance by combining traditional credit risk strategies with first-party fraud analytics to identify hidden risk and improve early payment default detection.
Key insights:
 Infographic
A concise guide to simplifying business credit modeling with automation. Learn how microservices streamline validation, testing, and analysis to help relationship managers, credit analysts, and adjudicators reduce manual effort, improve risk visibility, and make faster, more confident lending decisions.
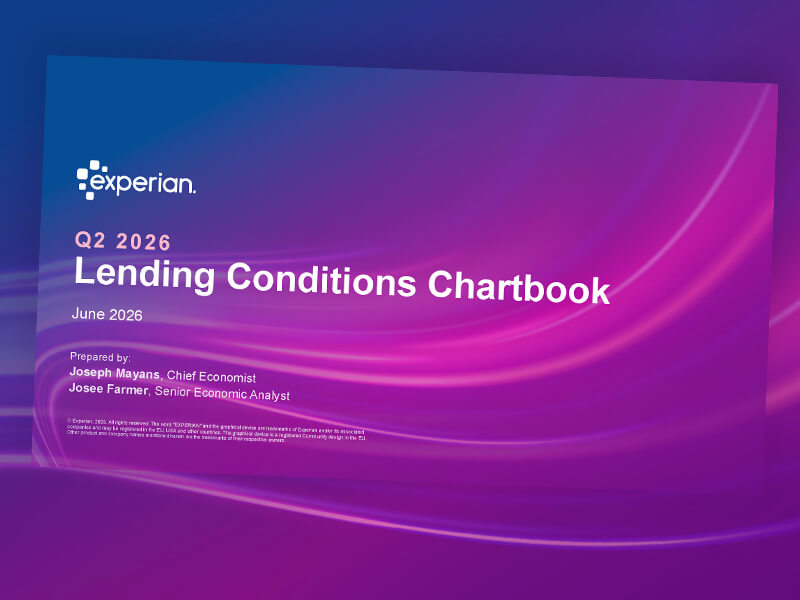 Report
Understand the economic and consumer trends shaping today's lending environment.
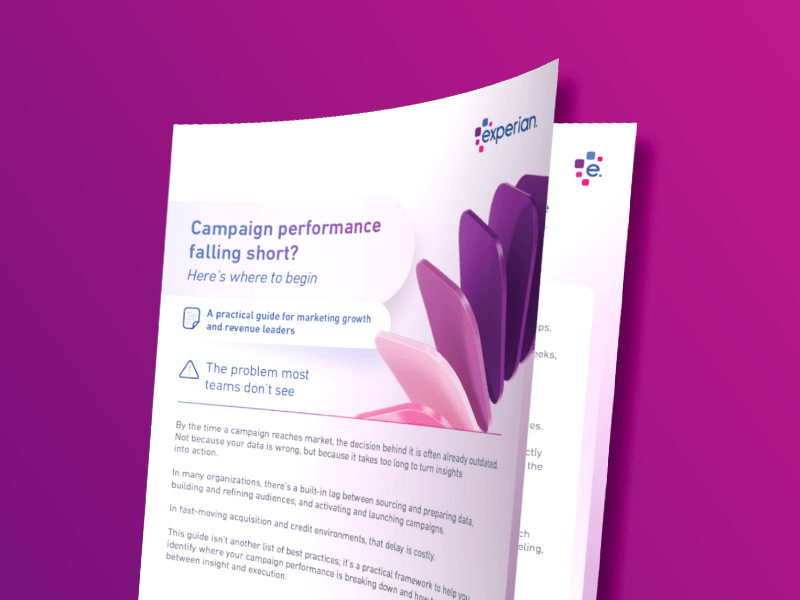 White Paper
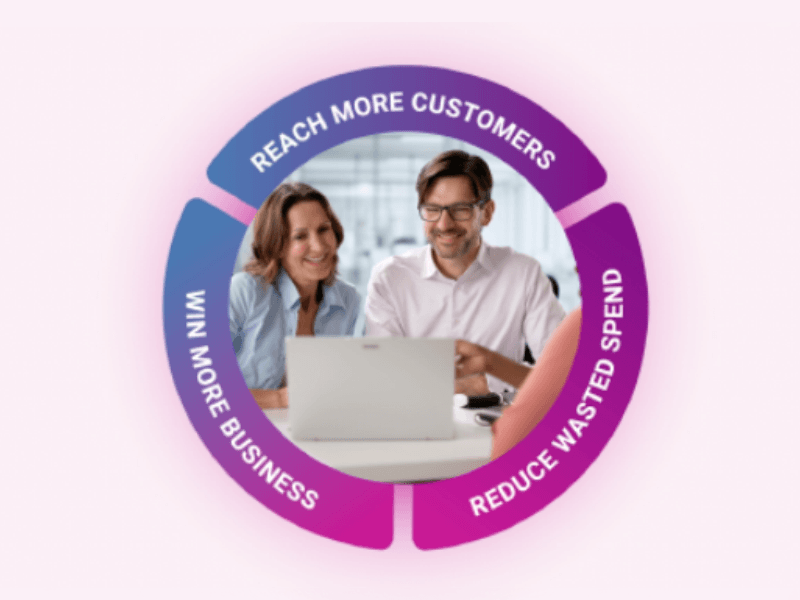
By the time your campaign launches, the data behind it is already outdated. The result? Missed opportunities, wasted spend and underperforming campaigns.
In this white paper, you’ll learn how to:

The latest insights, tips, and trends on all things related to commercial risk by the Experian Business Information Services team.

Experian Employer Services’ HR, payroll and tax experts share news, insights and best practices for employer compliance topics and challenges.

Experian's Global News Blog is your go-to source for the latest news, insights and trends in the world of data and analytics.

Experian Health’s blog features the latest trends and insights shaping the future of healthcare.

Helping businesses make faster, smarter, and more inclusive decisions with the power of data, analytics, and technology.

Marketing insights and solutions to help you drive more meaningful interactions so your consumers can connect, engage, and thrive.

Small business advice and credit education, news, and trends.