Infographic
Published December 4, 2024
Energy & Utilities Telecommunications Collections & Debt Recovery
Did you know that U.S. residential electricity prices have risen by 25% over the past five years? 1 Download our tip sheet to learn four strategic actions that utility and telecom service providers can take to navigate current collection challenges and dramatically transform outcomes.
Explore how to:
- Successfully prioritize and implement a data-driven strategy.
- Ensure accurate contact data with skip-tracing tools.
- Leverage technology and AI/ML models to improve operations.
- Enhance the customer experience by tailoring interactions.
1. U.S. Energy Information Administration
Click the button below to access the infographic
View now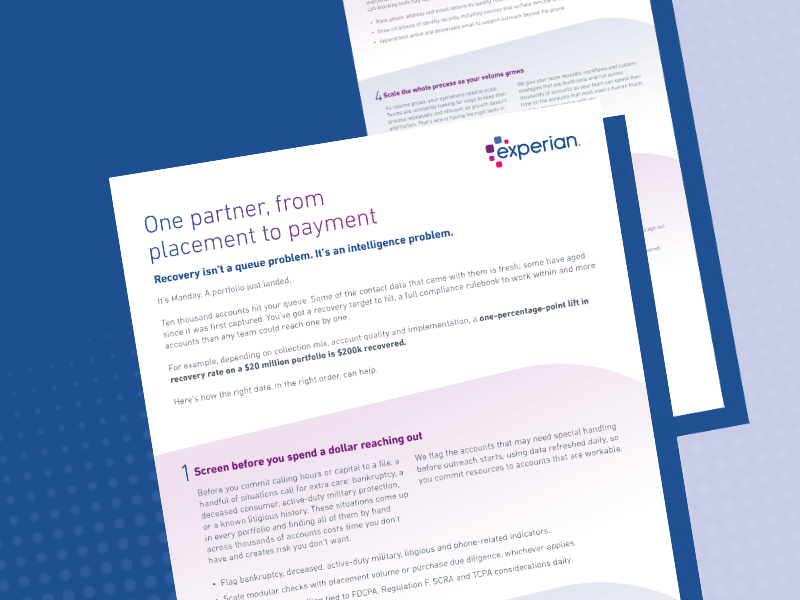 Tip Sheet
One Partner, From Placement to Payment
The right data, in the right order is helping collections teams improve recovery across their portfolio. In our latest tip sheet, learn how to:
- Screen accounts for special handling before outreach
- Prioritize accounts by recovery and payment likelihood
- Improve contact strategies with current identity data
- Scale recovery with reusable workflows and custom strategies
 Report
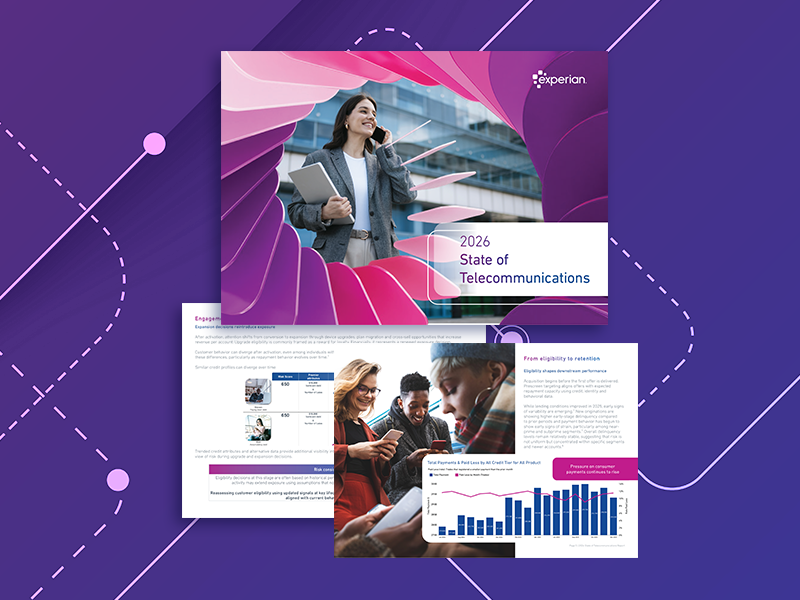
2026 State of Telecommunications Report
Telecom providers are operating in a mature market where customer behavior and credit trends are shaping performance. This report explores how those shifts influence outcomes across the lifecycle, including:
- Early-stage delinquency and payment behavior
- Acquisition and upgrade exposure
- Alternative data, including ITIN populations
- Lifecycle drivers of long-term performance
 Report
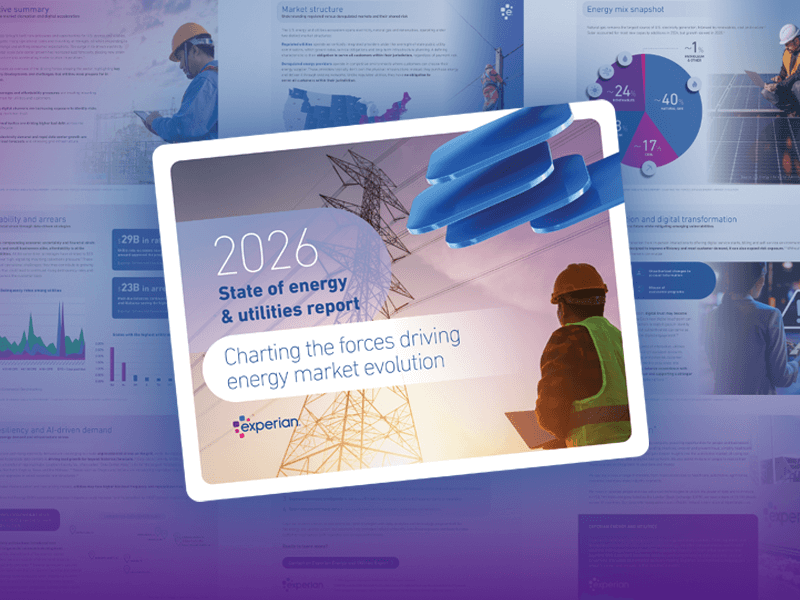
2026 State of Energy and Utilities Report
Read our first-ever State of Energy and Utilities Report examining the forces shaping the industry this year.
- Rising arrearages and affordability pressures
- Expanding digital channels and identity-related fraud exposure
- AI-driven demand, data center growth and grid resiliency challenges
- Data-driven strategies to reduce risk and strengthen customer trust
 Infographic
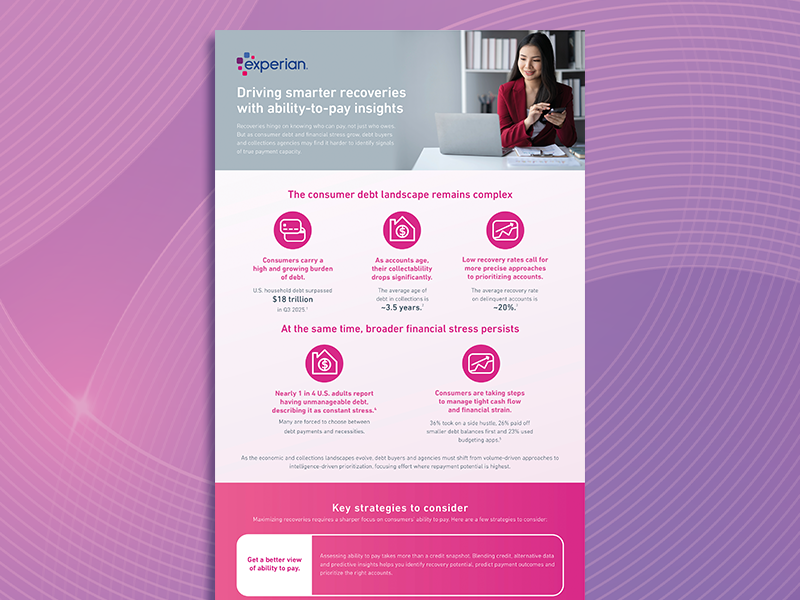
Driving smarter recoveries with ability-to-pay insights
Recoveries hinge on knowing who can pay, not just who owes. This infographic explores how debt buyers and collections agencies can better identify signals of true payment capacity.
Did you know?
- U.S. household debt surpassed $18 trillion in Q3 2025.1
- The average age of debt in collections is ~3.5 years.2
- The average recovery rate on delinquent accounts is ~20%.3
Read the infographic for more insights and strategies to drive smarter recoveries.
1Household Debt and Credit report, Q3 2025, Federal Reserve Bank of New York.
2Debt Collection Industry Statistics, zipdo.
3Collections Industry Statistics, Gitnux.