Automotive

According to Experian’s Q3 2019 State of the Automotive Finance Market report, used vehicle financing increased across all credit tiers.

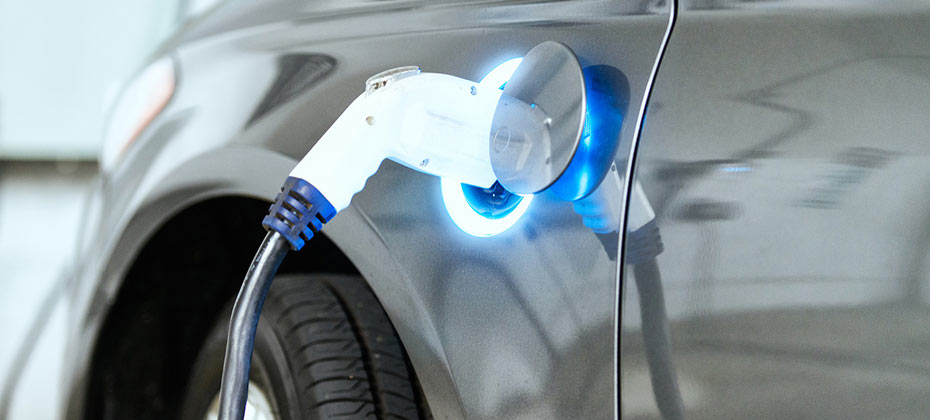
Electric vehicles have 2.08 percent of total VIO share through September 30, 2019

The Experian Automotive Intelligence Engine™ enables dealers to find and reach potential customers

The average new vehicle loan hit $32,119 in Q2 2019. Average used vehicle loan amounts reached $20,156 in Q2 2019.

Introducing the newly designed AutoCheck Score™ Quickly compare and select used vehicles As an auto industry professional, you use vehicle history reports every day. But they’re long, complex — easily misinterpreted. You always aim to conduct a thorough inspection. But what if you’re at a busy auction house or browsing online, where there’s simply not enough time or context? The tool you use every day to make critical decisions about used vehicles should be accurate and easy to understand — built for streamlined evaluation. So we made one. New look, same impact We’ve revamped the AutoCheck score with a modern look and feel that’s easier than ever to read. And it’s still invaluable for quickly comparing and selecting used vehicles. What, exactly, is it? Experian® analyzes the detailed records in an AutoCheck® vehicle history report to generate the AutoCheck Score. Like a credit score or gas mileage rating for new vehicles, it’s a single number on a standardized scale. The new gauge shows the score range (from 1 - 100) for vehicles of similar age in the same class. If a car is above average in its range, you can feel confident that it’s a solid investment. The score makes it much simpler to assess how a used vehicle measures up, estimating its: Overall roadworthiness Reliability compared to other vehicles in its class Likelihood of being on the road in five years It is invaluable for making informed decisions, managing inventory, mitigating risk and instilling confidence in customers. Bigger, better You can depend on the AutoCheck Score to deliver a high-quality, more accurate assessment. That’s because it’s derived from Experian’s world-class, continually updated database, which leverages reliable information from extensive sources, including: Tens of thousands of distinct accident sources, many exclusive to Experian 95% of U.S. auction houses — most providing structural damage, salvage-and-junk and export-data announcements exclusively to Experian Important OEM safety and open recall data State departments of motor vehicles and departments of public safety, insurance companies and other independent sources Police department/state agency accident information from all 50 states and Washington D.C. Federal sources, like import records That’s a lot of data. And some complex statistical modeling. Don’t worry; we’ll take care of the heavy lifting. All you have to do is keep score. Why you need it Whether you’re a dealer, lender, manufacturer certified pre-owned program or consumer portal, the score will transform the way you do business to boost your bottom line. Dealers: Use the score to mitigate risk, manage and market your inventory, close sales faster and build customer loyalty. Lenders/Credit Unions: Use the score to more accurately estimate a vehicle’s value at every stage of the loan life cycle, from origination to portfolio review, account management and asset collection. Manufacturer Certified Pre-Owned Programs: Use the AutoCheck report for vehicle certification. Consumer Portals: Increase customer satisfaction — and traffic — by allowing OEMs and dealers to post the score with their listings and make online car shopping a breeze. Count on the AutoCheck Score To learn more about the score — or how to wield its power to maximal effect — find its secrets in this treasure trove of a white paper or call 1 888 675 5596. What are you waiting for? Redesign your business with the redesigned score.

Experian Boost provides a unique opportunity to help dealers build loyalty while helping consumers.

Pickups are the most common vehicle in operation at 20% share today and hold 16.5% of new vehicle registrations in the market in Q1 2019.

There are thousands of potential car buyers heading into dealerships and browsing websites for their next vehicle every day. And that means thousands of opportunities for automotive manufacturers to market their vehicles to prospective buyers. But not every vehicle is going to meet the needs and wants of every car buyer. So, how do automotive brand marketers reach the individuals most likely to be interested in their products? Simply put, it comes down to better understanding the brand’s audience. But, today’s digitally-driven world creates a significant challenge for brand marketers – the overreliance on mobile devices and digital channels creates hundreds of digital touchpoints for brand marketers to consider. But, the data also creates an opportunity. If automotive marketers can bridge the gap between online and offline touchpoints, they’ll be better positioned to develop messages that resonate with their desired audience and deliver communications through the most effective channels. The end result? More meaningful interaction with potential car buyers. To get there, automotive marketers need to consider these concepts: Navigate the identity resolution process The secret to a more relevant conversation begins and ends with knowing who you are addressing. People interact with brands through a variety of channels. For example, a person may see an advertisement for a new vehicle on their smartphone, later research the same vehicle at home on their desktop or on a mobile app and test drive the vehicle a few days later. The automotive marketer that can reconcile these three different interactions will be able to deliver relevant advertisements to the individual and cut down on wasted advertising spend. Knowledge-based identity resolution is what allows you to be smarter with your marketing. Present the right offer People are bombarded with hundreds, if not thousands, of advertisements daily. Automotive marketers need to cut through the noise and deliver messages that resonate with the target audience – whether it’s through e-newsletters, 30-second TV spots, banner ads or direct mail pieces. If automotive manufacturers miss the mark, it could lead to a frustrated consumer and poor brand reputation. For instance, an automotive marketer would not want to advertise the latest minivan to a couple who are empty nesters. Create customer loyalty It’s important to stay on top of current market statistics and data to fine-tune marketing campaigns. Vehicle ownership and purchase patterns can vary greatly in each market, and that means brands might need to fine-tune long-term loyalty strategies. A loyalty program that works in the Northeast might not work well for the Midwest market based on car buying patterns and the reasons behind owning a car. Data can help prioritize resources in areas with the highest potential for sales growth. Experian Marketing EngineTM helps automotive manufacturers engage customers across every channel while making the most of a marketing budget. It’s designed to seamlessly collect, consolidate and use customer data by connecting offline and online identifiers to create a single customer view. Experian’s North American Vehicle Database alone has over 11 billion records and over 900 million vehicles, of which over 68 million are Canadian vehicles. Marketing Engine leverages automotive specific insights, including vehicle purchase behaviors and ownership data, and combines that with other marketing data such as demographics and lifestyle interests. These automotive tools provide a more unified approach so that brands can make more informed decisions, gain and retain new customers, and drive sales. Learn more at https://www.experian.com/automotive/marketing.

Vehicle affordability has been a main topic of conversation in the auto industry for some time, and based on the data, it’s not going unnoticed by consumers. The average new vehicle loan in Q1 2019 reached $32,187, while the average new vehicle monthly loan payment hit $554. How are car shoppers reacting? Perhaps the biggest shift in Q1 2019 was the growth of prime and super prime customers opting for used vehicles. The percentage of prime (61.88 percent) and super-prime (44.78 percent) consumers choosing used vehicles reached an all-time high in Q1 2019, according to Experian data. Not only are we seeing new payment amounts increase, but used loan amounts and payments are on the rise as well, though the delta between the two can be one of the reason we’re seeing more prime and super prime opt for used. The average used vehicle loan was slightly above $20,000 in Q1 2019, while the average used vehicle payment was $391. We know that consumers often shop based on the monthly payment amount, and given the $163 difference between average monthly payments for new and used, it’s not surprising to see more people opt for used vehicles. Another way that consumers can look to have a smaller payment amount is through leasing. We’re continuing to see that the top vehicles leased are more expensive CUVs, trucks and SUVs, which are pricier vehicles to purchase. But with the average lease payment being $457 per month, there’s an average difference of $97 compared to loan payments. In Q1 2019, leasing was down slightly year-over-year, but still accounted for 29.07 percent of all vehicle financing. On the other side of the affordability equation, beyond cost of vehicles, is concern around delinquencies: will consumers be able to make their payments in a timely manner? So far, so good. In Q1 2019, 30-day delinquencies saw an increase to 1.98 percent, up from 1.9 percent a year ago. That said, banks, credit unions and finance companies all saw slight decreases in 30-day delinquency rates, and 60-day delinquencies remained relatively stable at 0.68 percent year-over-year. It’s important to keep in mind that the 30-day delinquency rate is still well-below the high-water mark in Q1 2009 (2.81 percent). The vehicle finance market appears to remain strong overall, despite rising vehicle costs, loan amounts and monthly payments. Expect consumers to continue to find ways to minimize monthly payments. This could continue the shift into used vehicles. Overall, as long as delinquencies stay flat and vehicle sales don’t taper too badly, the auto finance market should stay on a positive course. To watch the full Q1 2019 State of the Automotive Finance Market webinar, click here.

There were 276 million vehicles on the road in Q1 2019.

Consumer credit trends and markets are constantly evolving, particularly when it comes to originations and delinquencies on mortgages, credit cards and auto loans. According to Experian research, over 2.7 million out of 89 million active automotive loans and leases are either 30 or 60 days delinquent. Triggers that signal a greater likelihood of consumers falling delinquent on loans, mortgages and credit card payments, include high-interest rates, a high utilization rate and recent derogatory trades. By tracking and forecasting consumer trends over time, you can more easily predict consumer behavior and better prepare for potential issues within each market. Join Gavin Harding, Experian Senior Business Consultant, and Alan Ikemura, Experian Data Analytics Senior Product Manager, during our live Quarterly Credit Trends webinar on May 30 at 2:00 p.m. ET. Our expert speakers will provide a view of the real estate market and share insights on the latest consumer credit trends. Highlights include: 2019 economic drivers Q1 2019 origination and delinquency trends Mortgage Home equity Bankcard Auto Register now

Beginning with the birth of stock muscle cars, like the Pontiac GTO, vehicles with powerful V8 engines permeated the roads in the 1960s. Given consumers’ “need for speed,” these vehicles were synonymous with American culture following World War II - some going as far as to call muscle cars as American as apple pie. It’s no doubt that these vehicles have made an undeniable lasting impression on the automotive industry. Today, there are still automotive enthusiasts who appreciate the style and strength of the muscle car, but most of us want practical vehicles with better fuel economy and easy maintenance. This has resulted in a dramatic increase in the volume of 4-cylinder vehicles on the road. As seen in the graphic above, over the last 11 years, 4-cylinder engines have increased in volume over 55%, 6-cylinder have declined 4% and 8-cylinders have increased 9.8%. More power, smaller engines This trend doesn’t necessarily mean that those of us who elect for a smaller engine size aren’t able to satisfy our need for speed. Horsepower has received a significant boost over the past two decades. This has been partially driven by EPA guidelines, as manufacturers have implemented engine enhancements to increase gas mileage to meet the guidelines, resulting in higher horsepower. 4-cylinder engines have as much horsepower today as 6-cylinder engines had in 2003. That gives today’s drivers a lot more pep in engine performance. Similarly, today's 6-cylinder engines have nearly the same horsepower today that V8s had in 2009. Where does that leave true muscle car enthusiasts? Well, if you are looking for raw power, things are looking up. In 2018, V8 engines averaged a whopping 370.4 horsepower, nearly double V8 output of 204 horsepower in 1999. Those who buy V8s today have power to burn. Above chart detailing percentage of total volume count and average vehicle MAX HP over history. The automotive market is driven by consumer preferences and offers a range of engine options, which provides something for everyone. The boost in horesepower in today’s engines provides a nice mix of fuel economy and performance. While muscle cars remain an important fixture in American society and automotive culture, demand has shifted and understanding these data points in the broader industry context empowers dealers to make the right inventory decisions. To learn more about the latest automotive trends impacting the marketplace, view the full Q4 2018 Automotive Market Trends Analysis.

When it comes to new vehicle registration, there is one segment that stands out from the pack: crossover vehicles. According to Experian’s Q4 2018 Automotive Market Trends Analysis, over the last four years, crossovers (CUVs) have spiked in popularity, representing about a third of new vehicle registrations in 2014 (34.1 percent), but growing to nearly half the new vehicle market in 2018 (47.6 percent). In fact, the large growth in CUVs isn’t limited to just the last four years – there was a large volume of growth year-over-year compared to 2017; the share has grown nearly 4 percent. Sedans and hatchbacks, meanwhile, have seen their share decrease year-over-year. The charts below detail this change in market, based on Experian’s latest 2018 quarterly findings. Source: Experian Automotive VIO as of December 31, 2018 (light duty registered vehicles only) What’s driving this growth? Across the board, the number of light-duty vehicles on the road continues to increase, up to 275.3 million in the U.S. market, at the end of 2018, compared to 271.4 million a year prior. The growth in CUVs isn’t entirely unprecedented, as it’s been going on for a number of years. CUVs continue to grow in popularity for a variety of reasons including: Greater visibility, as the driver sits higher than in a sedan/coupe Larger storage capacities for passengers or cargo Number of varieties available, such as size, engines, and manufactures Higher fuel efficiency than a full-size SUV or minivan Currently, there are over 130 different CUV/SUV Make/Model combos offered, and of those, the different engines, options, etc. drive that volume even higher. Source: Experian Automotive VIO as of December 31, 2018 (light duty registered vehicles only) Potential for growth Currently, there are only two CUVs among the top vehicles in the aftermarket “sweet spot.” Vehicles in the sweet spot are 6 to 12 model years old, and typically aged out of general OEM warranties for any repairs. These vehicles likely require more part replacement services, which may be performed by aftermarket service shops using parts from aftermarket part manufacturers. According to Experian data, the sweet spot has stopped falling and has settled for now. But, there is expected growth of the number of vehicles that fall into the sweet spot over the coming years. One of the segments where the aftermarket industry can begin to focus on will be CUVs. Source: Experian Automotive VIO as of December 31, 2018 (light duty registered vehicles only) The aftermarket can use this data to make more informed product decisions, specifically, around the high volume of CUVs expected to come into the sweet spot. With the number of vehicle options available on the market today, CUVs will continue to stand out as a segment to watch within the auto industry. There’s a greater story beyond the numbers and understanding how to leverage the data at hand can provide the industry with a greater understanding of CUVs and its potential for even greater growth. To learn more about CUVs/SUVs and total vehicles in operation, view the full Q4 2018 Automotive Market Trends Analysis.

There’s recently been a significant amount of discussion about the stability of the automotive finance industry. Many fear the increase in the volume of delinquent U.S. automotive loans may be an early stage harbinger of the downfall of the automotive industry. But, the fact is, that’s not entirely true. While we certainly want to keep a close eye on the volume of delinquent loans, it’s important to put these trends into context. We’ve seen a steady increase in the volume of outstanding loan balances for the past several years – though the growth has slowed the past few quarters. And while much of the increase is driven by higher loan amounts, it also means there’s been an overall higher volume of vehicle buyers leaning on automotive lenders to finance vehicles. In fact, findings from our Q4 2018 State of the Automotive Finance Market Report show 85.1 percent of all new vehicle purchases were financed in Q4 2018 – compare that to 81.4 percent in Q4 2010 and 78.2 percent in Q4 2006. Suffice it to say, more financed vehicles will undoubtedly lead to more delinquent loans. But that also means, there is a high volume of car buyers who continue to pay their automotive loans in a timely manner. Through Q4 2018, there were nearly 86 million automotive loans and leases that were in good standing. With a higher volume of automotive loans than in the past, we should pay close attention to the percentage of delinquent loans compared to the overall market and compare that to previous years. And when we examine findings from our report, the percentage of automotive loans and leases that were 30-days past due dropped from 2.36 percent to 2.32 percent compared to a year ago. When we look at loans and leases that were 60-days past due, the percentages are relatively stable (up slightly from 0.76 percent to 0.78 percent compared to a year ago). It’s worth noting, these percentages are well below the high-water mark set during Q4 2009 when 3.30 percent of loans were 30-days delinquent and 0.94 percent of loans were 60-days delinquent. But, while the rate of delinquency is down and/or relatively stable year-over-year, it has trended upward since Q4 2015 – we’ll want to stay close to these trends. That said, much of the increase in the percentage of 60-day delinquent automotive loans is a result of a higher percentage of deep subprime loans from previous years – high-risk originations that become delinquent often occur more than 16 months after the origination. Additionally, the percentage of deep subprime originations has steadily decreased over the past two years, which could lead to a positive impact on the percentage of delinquent automotive loans. Despite rising automotive loan amounts and monthly payments, the data shows consumers appear to be making their payments on-time – an encouraging sign for automotive lenders. That said, lenders will want to continue to keep a close eye on all facets of car buyers’ payment performance moving forward – but it is important to put it into context. A clear understanding of these trends will better position lenders to make the right decisions when analyzing risk and provide consumers with comprehensive automotive financing options. To learn more about the State of the Automotive Finance Market report, or to watch the webinar, click here.

Like every other industry, the automotive market is driven by consumer preferences and behavior. While there are a myriad of options to choose from, fuel-type seems to dominate media headlines as a hot topic of conversation among industry pundits and consumers, alike. Little surprise then that alternative fuel vehicles, which include diesels and hybrids, have maintained a steady demand over the past few years. But, there’s a specific segment that’s beginning to emerge. As we detailed in our earlier blog series, electric vehicles (EVs) are began to stand out as a prominent alternative fuel vehicle. And during Q3 2018, we saw more of the same. EVs held 1.8 percent share of total vehicle registrations. While that number may seem small, consider this. Just two years ago, in 2016, EVs comprised only 0.5 percent of registrations, growing at a much slower pace since 2014, when it was 0.4 percent. It’s worth noting that gasoline-powered cars still dominate the market, making up 92.9 percent of registered vehicles through Q3 2018. But, the demand for alternative fuel type options should not be underestimated. Alternative fuel vehicles are becoming a significant segment in today’s auto market, and the large growth in EVs are a testament to that growth. While EVs are proving to be a popular option compared to other alternative fuel types, other options remained steady. Diesel vehicles maintained 2.8 percent of the market year-over-year, while hybrid vehicles saw a slight increase since 2017, growing from 2.6 to 2.8 percent of the market. A picture of the alternative fuel buyer So, who’s investing in these alternative fuel vehicles? We see that most buyers tend to be married, single family home owners with a college education, and belong to either the Baby Boomer generation or Gen X. It’s interesting to note that EVs make up a notable percentage of registrations of alternative fuel type preferences across generational car buyers, according to Q3 registration data. Among Baby Boomers, EVs fall second to hybrids, accounting for 1.0 percent of registered alternative fuel type vehicles compared to 1.2 percent respectively. But, EVs made up the biggest share of alternative fuel type registrations among Millennials (1.1 percent) and Gen X’ers (1.2 percent). With the number of vehicle options available on the market today, EVs stand out as a segment to watch within the auto industry. There’s a greater story beyond the numbers and understanding how to leverage the data at hand can provide the industry with a greater understanding of the EV market and its potential. To learn more about the electric vehicle market and other alternative fuel type vehicles, view the full Q3 2018 Automotive Market Trends Analysis webinar.
