Tag: delinquency

After being in place for more than three years, the student loan payment pause is scheduled to end 60 days after June 30, with payments resuming soon after. As borrowers brace for this return, there are many things that loan servicers and lenders should take note of, including: Potential risk factors demonstrated by borrowers. About one in five student loan borrowers show risk factors that suggest they could struggle when scheduled payments resume.1 These include pre-pandemic delinquencies on student loans and new non-medical collections during the pandemic. The impact of pre-pandemic delinquencies. A delinquent status dating prior to the pandemic is a statistically significant indicator of subsequent risk. An increase in non-student loan delinquencies. As of March 2023, around 2.5 million student loan borrowers had a delinquency on a non-student loan, an increase of approximately 200,000 borrowers since September 2022.2 Transfers to new servicers. More than four in ten borrowers will return to repayment with a new student loan servicer.3 Feelings of anxiety for younger borrowers. Roughly 70% of Gen Z and millennials believe the current economic environment is hurting their ability to be financially independent adults. However, 77% are striving to be more financially literate.4 How loan servicers and lenders can prepare and navigate Considering these factors, lenders and servicers know that borrowers may face new challenges and fears once student loan payments resume. Here are a few implications and what servicers and lenders can do in response: Non-student loan delinquencies can potentially soar further. Increased delinquencies on non-student loans and larger monthly payments on all credit products can make the transition to repayment extremely challenging for borrowers. Combined with high balances and interest rates, this can lead to a sharp increase in delinquencies and heightened probability of default. By leveraging alternative data and attributes, you can gain deeper insights into your customers' financial behaviors before and during the payment holidays. This way, you can mitigate risk and improve your lending and servicing decisions. Note: While many student loan borrowers have halted their payments during forbearance, some have continued to pay anyway, demonstrating strong financial ability and willingness to pay in the future. Trended data and advanced modeling provide a clearer, up-to-date view of these payment behaviors, enabling you to identify low-risk, high-value customers. Streamlining your processes can benefit you and your customers. With some student loan borrowers switching to different servicers, creating new accounts, enrolling in autopay, and confirming payment information can be a huge hassle. For servicers that will have new loans transferred to them, the number of queries and requests from borrowers can be overwhelming, especially if resources are limited. To make transitions as smooth as possible, consider streamlining your administrative tasks and processes with automation. This way, you can provide fast and frictionless service for borrowers while focusing more of your resources on those who need one-on-one assistance. Providing credit education can help borrowers take control of their financial lives. Already troubled by higher costs and monthly payments on other credit products, student loan payments are yet another financial obligation for borrowers to worry about. Some borrowers have even stated that student loan debt has delayed or prevented them from achieving major life milestones, such as getting married, buying a home, or having children.5 By arming borrowers with credit education, tools, and resources, they can better navigate the return of student loan payments, make more informed financial decisions, and potentially turn into lifelong customers. For more information on effective portfolio management, click here. 1Consumer Financial Protection Bureau. (June 2023). Office of Research blog: Update on student loan borrowers as payment suspension set to expire. 2Ibid. 3Ibid. 4Experian. (May 2023). Take a Look: Millennial and Gen Z Personal Finance Trends 5AP News. (June 2023). The pause on student loan payment is ending. Can borrowers find room in their budgets?
Despite an unprecedented 18 months since the pandemic was in full force and many Americans were sent home, financial wellness continues to be on the up and up. Consumers continue to manage credit well and the average credit score climbed seven points since 2020 to 695, the highest point in more than 13 years. In Experian’s 12th annual State of Credit report, the headlines are hopeful regarding how Americans are managing personal finances in the face of the pandemic. The report provides a comprehensive look at the credit performance of consumers across America by highlighting consumer credit scores and borrowing behaviors. This year’s report features data from 2019 pre-pandemic, the 2020 pandemic year, and the start of 2021. “The findings from this year’s report show something I’ve always believed: Americans are resilient, for the most part they make smart decisions in the face of adversity and they are agile in adjusting their financial habits when the environment or circumstances change,” said Alex Lintner, President, Experian Consumer Information Services. Highlights of Experian’s State of Credit report: 2021 State of Credit Report 2019 2020 2021 Average VantageScore® credit score [1] 682 688 695 Median VantageScore® credit score 687 697 707 Average number of credit cards 3.0 3.0 3.0 Average credit card balance $6,494 $5,897 $5,525 Average revolving utilization rate 30% 26% 25% Average number of retail credit cards 2.50 2.42 2.33 Average retail credit card balance $1,930 $2,044 $1,887 Average nonmortgage debt $25,057 $25,483 $25,112 Average mortgage debt $210,263 $215,655 $229,242 Average auto loan or lease $19,034 $19,462 $20,505 Average 30–59 days past due delinquency rates 3.8% 2.4% 2.3% Average 60–89 days past due delinquency rates 1.9% 1.3% 1.0% Average 90–180 days past due delinquency rates 6.6% 3.8% 2.5% We asked Joseph Mayans, Principal Economist at Advantage Economics, LLC, for his reactions to the findings: “The State of Credit Report captures the three central themes of the pandemic. First, it shows the overwhelming success of the fiscal support packages. By far, the most striking example of this is the broad based and significant decline in delinquencies during a time when millions of people were out of work. Second, the report showcases the resiliency of American households. People used their stimulus dollars to stay on top of their bills and pay down debt, which boosted average credit scores across all generations. And third, it highlights the unique behavioral shifts brought on by the pandemic. We can see these changes in the rise of housing and auto debt as people bought larger homes and sought to drive rather than ride public transportation.” Generational Trends As indicated in the findings, consumers across all generations except Gen Z saw decreased utilization rates and decreased credit card balances year over year. Consumers are also missing fewer payments with notable improvements seen among the youngest consumers. Mortgage debt was up across every generation, which may correlate with the record low interest rates on mortgages, refinances and moves. According to the CBRE, “the pandemic accelerated several long-standing American migration patterns” as evidenced by more than 15.9 million people filing change-of-address requests with the United States Postal Service. Compared with 2019, 2020 change-of-address requests show a 4% increase in total movers, 2% increase in permanent movers and 27% increase in temporary movers, according to a study by MyMove. Mayans also made note of the mortgage trends. “It’s becoming clearer that millennials are stepping into the homebuying phase in a big way. Once thought to be the generation of apartments and urban revival, many older millennials are now buying homes and moving to the suburbs much like their parents before them,” Mayans said. “This will have significant implications for the post-pandemic world, especially as work from home becomes more prevalent.” State Trends The states with the highest and lowest average credit score remained unchanged from last year with the highest average score of 726 held by Minnesota and an average score of 666 held by Mississippi. New Jersey had the highest number of credit cards and retail cards at 3.37 and 2.54 respectively, and Alaska had the highest credit card debt at $7,089 (U.S. average is $5,525) and Texas had the highest retail debt at $2,248 (U.S. average is $1,888). What Lies Ahead Some have argued that the past year of the pandemic and quarantine forced a lot of time for reflection. The continued positive trends of consumer behavior seem to indicate some of that effort was put toward better financial health practices. That said, like any sourdough bread recipe or DIY home glow-up, there’s always more to learn and opportunities to seize when it comes to financial health. “We are committed to working with lenders and the industry to help consumers gain access to credit, driving broader financial inclusion, while also teaching consumers how to responsibly build and use credit responsibly,” Lintner said. In addition to the free weekly credit report at AnnualCreditReport.com, Experian also offers consumers free access to their credit report and ongoing credit monitoring at Experian.com. Additional credit education resources and tools Join Experian’s #creditchat hosted by @Experian on Twitter with financial experts every Wednesday at 3 p.m. Eastern time. Bilingual and Spanish speakers are also invited to join Experian’s monthly #ChatdeCredito hosted on Twitter at 3 p.m. Eastern time beginning September 16. Visit the Ask Experian blog for answers to common questions, advice and education about credit. Add positive telecom, utility and streaming service payments to your Experian credit report for an opportunity to improve your credit scores by visiting experian.com/boost[2] For additional resources, visit https://www.experian.com/consumereducation To see all the findings, download the 2021 State of Credit Report. Download the full report [1] VantageScore® is a registered trademark of VantageScore Solutions, LLC. VantageScore® credit score range is 300 to 850. [2] Results may vary. See Experian.com for details
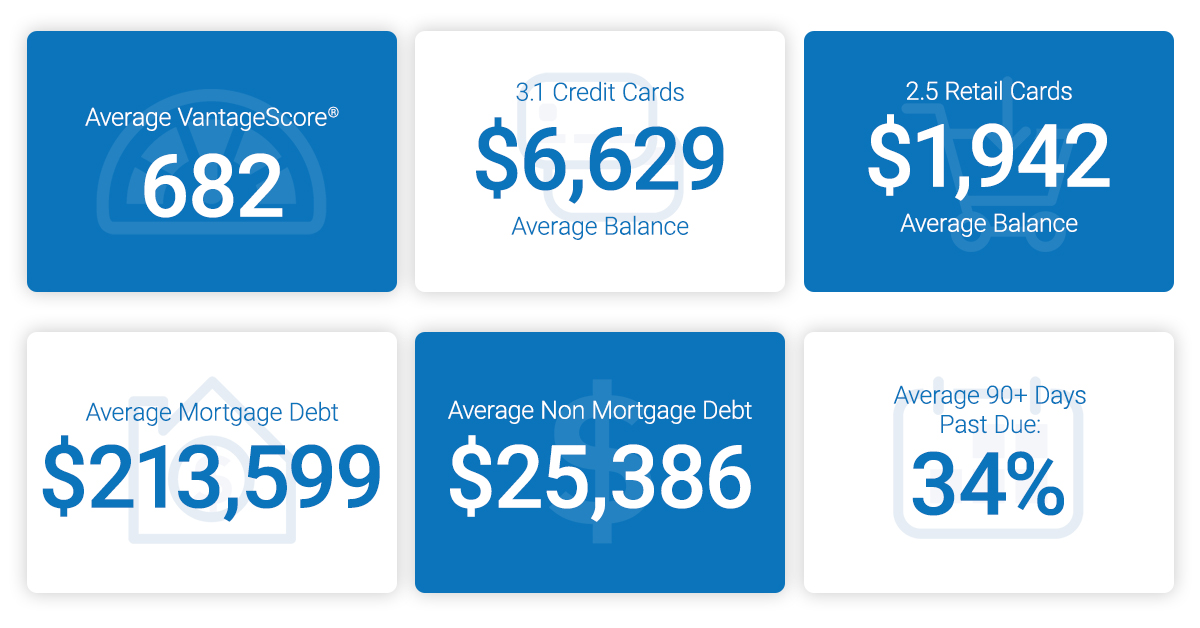
As consumers prepare for the next decade, we look at how we’re rounding out this year. The results? The average American credit score is 682, an eight-year high. Experian released the 10th annual state of credit report, which provides a comprehensive look at the credit performance of consumers across America by highlighting consumer credit scores and borrowing behaviors. And while the data is spliced to show men vs. women, as well as provides commentary at the state and generational level, the overarching trend is up. Even with the next anticipated economic correction often top of mind for financial institutions, businesses and consumers alike, 2019 was a year marked by more access, more spending and decreasing delinquencies. Things are looking up. “We are seeing a promising trend in terms of how Americans are managing their credit as we head into a new decade with average credit scores increasing two points since 2018 to 682 – the highest we’ve seen since 2011,” said Shannon Lois, Senior Vice President and Head of EAS, Analytics, Consulting & Operations for Experian Decision Analytics. “Average credit card balances and debt are up year over year, yet utilization rates remain consistent at 30 percent, indicating consumers are using credit as a financial tool and managing their debts responsibly.” Highlights of Experian’s State of Credit report: 3-year comparison 2017 2018 2019 Average number of credit cards 3.06 3.04 3.07 Average credit card balances $6,354 $6,506 $6,629 Average number of retail credit cards 2.48 2.59 2.51 Average retail credit card balances $1,841 $1,901 $1,942 Average VantageScore® credit score[1, 2] 675 680 682 Average revolving utilization 30% 30% 30% Average nonmortgage debt[3] $24,706 $25,104 $25,386 Average mortgage debt $201,811 $208,180 $231,599 Average 30 days past due delinquency rates 4.0% 3.9% 3.9% Average 60 days past due delinquency rates 1.9% 1.9% 1.9% Average 90+ days past due delinquency rates 7.3% 6.7% 6.8% In the scope of the credit score battle of the sexes, women have a four-point lead over men with an average credit score of 686 compared to 682. Their lead is a continued trend since 2017 where they’ve bested their male counterparts. According to the report, while men carry more non-mortgage and mortgage debt than women, women have more credit cards and retail cards (albeit they carry lower balances). Generationally, Generations X, Y and Z tend to carry more debt, including mortgage, non-mortgage, credit card and retail card, than older generations with higher delinquency and utilization rates. Segmented by state and gender, Minnesota had the highest credit scores for both men and women, while Mississippi was the state with the lowest average credit score for females and Louisiana was the lowest average credit score state for males. As we round out the decade and head full-force into 2020, we can reflect on the changes in the past year alone that are helping consumers improve their financial health. Just to name a few: Experian launched Experian BoostTM in March, allowing millions of consumers to add positive payment history directly to their credit file for an opportunity to instantly increase their credit score. Since then, there has been over 13 million points boosted across America. Experian LiftTM was launched in November, designed to help credit invisible and thin-file consumers gain access to fair and affordable credit. Long-standing commitments to consumer education, including the Ask Experian Blog and volunteer work by Experian’s Education Ambassadors, continue to offer assistance to the community and help consumers better understand their financial actions. From what we can tell, this is just the beginning. “Understanding the factors that influence their overall credit profile can help consumers improve and maintain their financial health,” said Rod Griffin, Experian’s director of consumer education and awareness. “Credit can be used as a financial tool. Through this report, we hope to provide insights that will help consumers make more informed decisions about credit use as we prepare to head into a new decade.” Learn more 1 VantageScore® is a registered trademark of VantageScore Solutions, LLC. 2 VantageScore® credit score range is 300 to 850. 3 Average debt for this study includes all credit cards, auto loans and personal loans/student loans.

The fact that the last recession started right as smartphones were introduced to the world gives some perspective into how technology has changed over the past decade. Organizations need to leverage the same technological advancements, such as artificial intelligence and machine learning, to improve their collections strategies. These advanced analytics platforms and technologies can be used to gauge customer preferences, as well as automate the collections process. When faced with higher volumes of delinquent loans, some organizations rapidly hire inexperienced staff. With new analytical advancements, organizations can reduce overhead and maintain compliance through the collections process. Additionally, advanced analytics and technology can help manage customers throughout the customer life cycle. Let’s explore further: Why use advanced analytics in collections? Collections strategies demand diverse approaches, which is where analytics-based strategies and collections models come into play. As each customer and situation differs, machine learning techniques and constraint-based optimization can open doors for your organization. By rethinking collections outreach beyond static classifications (such as the stage of account delinquency) and instead prioritizing accounts most likely to respond to each collections treatment, you can create an improved collections experience. How does collections analytics empower your customers? Customer engagement, carefully considered, perhaps comprises the most critical aspect of a collections program—especially given historical perceptions of the collections process. Experian recently analyzed the impact of traditional collections methods and found that three percent of card portfolios closed their accounts after paying their balances in full. And 75 percent of those closures occurred shortly after the account became current. Under traditional methods, a bank may collect outstanding debt but will probably miss out on long-term customer loyalty and future revenue opportunities. Only effective technology, modeling and analytics can move us from a linear collections approach towards a more customer-focused treatment while controlling costs and meeting other business objectives. Advanced analytics and machine learning represent the most important advances in collections. Furthermore, powerful digital innovations such as better criteria for customer segmentation and more effective contact strategies can transform collections operations, while improving performance and raising customer service standards at a lower cost. Empowering consumers in a digital, safe and consumer-centric environment affects the complete collections agenda—beginning with prevention and management of bad debt and extending through internal and external account resolution. When should I get started? It’s never too early to assess and modernize technology within collections—as well as customer engagement strategies—to produce an efficient, innovative game plan. Smarter decisions lead to higher recovery rates, automation and self-service tools reduce costs and a more comprehensive customer view enhances relationships. An investment today can minimize the negative impacts of the delinquency challenges posed by a potential recession. Collections transformation has already begun, with organizations assembling data and developing algorithms to improve their existing collections processes. In advance of the next recession, two options present themselves: to scramble in a reactive manner or approach collections proactively. Which do you choose? Get started

Preparation is key – whether you’re an amateur/professional sports, free-soloing up El Capitan, or business contingency planning as part of a recession readiness strategy. It’s not so much predicting when events will occur, or trying to foresee and pivot for every possible outcome, but rather, acting now so that your business can act faster and smarter in the future. There are certain priorities that have come to be associated with what are widely accepted as the three environments the economy can sustain at any one time: As with recessions throughout the country’s history, those periods have often been characterized by layoffs, charge-offs, delinquencies, and other behaviors as the economy turns to a counter-cycle environment. Rather than wait to implement reactive strategies , the time to manage accounts, plan, stress test and implement contingency plans for when the next economic correction comes, is now. While economists and financial services industry experts argue over when a recession will hit and how severe its implications may be (in comparison with the Great Recession of 2008), there’s a need to start tactical business discussions now. Even in the face of a strong economy, that has seen high employment levels and increased spending, 45% of Americans (112.5 million) say they do not have enough savings to cover at least three months of living expenses, according to a 2018 survey by the Center for Financial Services Innovation. Regardless of the economic environment – pro-cycle, counter-cycle, and cycle-neutral – those statistics paint an alarming picture of consumers' financial health as a whole. These are four crucial considerations you should be taking now: Create individualized treatments while reducing manual interactions Meet the growing expectation for digital consumer self-service Understand your customer to ensure fair treatment React quickly and effectively to market changes While it may not be on the immediate horizon just yet, it’s important to prepare. For more information, including portfolio mixes, collections considerations and macroeconomic trends, download our latest white paper on recession readiness. Download white paper now

It’s been over 10 years since the first rumblings of Great Recession started in 2008. Today, Americans are experiencing high levels of consumer confidence, marked by high employment rates and increasing credit balances over last year. What have we learned over the last decade? And how do we compare to our behaviors then? Experian released the 9th annual state of credit report, which provides a comprehensive look at the credit performance of consumers across America by highlighting consumer credit scores and borrowing behaviors. Who’s faring the best since the recession? According to the data, younger consumers. “We’re continuing to see the positive effects of economic recovery, especially among younger consumers,” said Michele Raneri, Vice President of Analytics and Business Development at Experian. “Since the recession, responsible credit card behaviors and lower debt among younger consumers is driving an upward trend in average credit scores across the nation. Over the last ten years, those 18 – 21 increased their credit scores by 23 points on average compared to those 18-21 ten years ago.” As a whole, 2018 was a year marked by financial reform, consumer protection and the return of volatility for the financial markets. A large portion of the analytics from this year’s report took a close look at the credit behaviors of today and compared them to 2008, the year the US headed into the worst recession in 80 years. 10-Year Lookback 2008 2017 2018 Average number of credit cards 3.40 3.06 3.04 Average credit card balances $7,101 $6,354 $6,506 Average number of retail credit cards 3.03 2.48 2.59 Average retail credit card balances $1,759 $1,841 $1,901 Average VantageScore® credit score [1,2] 685 675 680 Average revolving utilization 28% 30% 30% Average non-mortgage debt $23,929 $24,706 $25,104 Average mortgage debt $191,357 $201,811 $208,180 Average 30 days past due delinquency rates 5.4% 4.0% 3.9% Average 60 days past due delinquency rates 2.9% 1.9% 1.9% Average 90+ days past due delinquency rates 7.1% 7.3% 6.7% In regards to credit scores, the average VantageScore® credit score increased 5 points from last year, reaching 680 , while still down from 2008. Segmented by state and gender, Minnesota had the highest credit scores for both men and women. Data also showed that women had higher credit scores than men, consistent with 2017 and 2008. The past year has been flooded with headlines illustrating increased spending for American consumers. How do the numbers compare with 2008 data? In comparison with 10 years ago, the number of retail trades since 2008 are down, while average balance is up, according to Experian’s State of Credit Report. Additionally, the number of credit cards is down for all age groups, and balance is also down for consumers 22-71 years of age. Average revolving utilization has creeped up in the past decade, but only two percentage points from 28% to 30%, while both average non-mortgage and mortgage debt has increased 5% and 9% respectively. Not surprisingly, the report reflects that delinquency rates have also increased over 20% since 2008, though down from last year. In conclusion, there’s a lot to learn from both 2008 and 2018. One of the most important and resonating takeaways might be that while fortune may not seem to favor the young, younger consumers are exhibiting responsible behaviors and higher credit scores, setting a precedence for consistent and better financial health in the future. Learn more Experian Boost can help consumers instantly improve their credit score by incorporating their positive payment history from utility and phone bills, among other consumer-permissioned data. [1] VantageScore® is a registered trademark of VantageScore Solutions, LLC. [2] VantageScore® credit score range is 300-850 Calculated on the VantageScore® model. Your VantageScore® credit score from Experian indicates your credit risk level and is not used by all lenders, so don’t be surprised if your lender uses a score that’s different from your VantageScore® credit score.

There’s recently been a significant amount of discussion about the stability of the automotive finance industry. Many fear the increase in the volume of delinquent U.S. automotive loans may be an early stage harbinger of the downfall of the automotive industry. But, the fact is, that’s not entirely true. While we certainly want to keep a close eye on the volume of delinquent loans, it’s important to put these trends into context. We’ve seen a steady increase in the volume of outstanding loan balances for the past several years – though the growth has slowed the past few quarters. And while much of the increase is driven by higher loan amounts, it also means there’s been an overall higher volume of vehicle buyers leaning on automotive lenders to finance vehicles. In fact, findings from our Q4 2018 State of the Automotive Finance Market Report show 85.1 percent of all new vehicle purchases were financed in Q4 2018 – compare that to 81.4 percent in Q4 2010 and 78.2 percent in Q4 2006. Suffice it to say, more financed vehicles will undoubtedly lead to more delinquent loans. But that also means, there is a high volume of car buyers who continue to pay their automotive loans in a timely manner. Through Q4 2018, there were nearly 86 million automotive loans and leases that were in good standing. With a higher volume of automotive loans than in the past, we should pay close attention to the percentage of delinquent loans compared to the overall market and compare that to previous years. And when we examine findings from our report, the percentage of automotive loans and leases that were 30-days past due dropped from 2.36 percent to 2.32 percent compared to a year ago. When we look at loans and leases that were 60-days past due, the percentages are relatively stable (up slightly from 0.76 percent to 0.78 percent compared to a year ago). It’s worth noting, these percentages are well below the high-water mark set during Q4 2009 when 3.30 percent of loans were 30-days delinquent and 0.94 percent of loans were 60-days delinquent. But, while the rate of delinquency is down and/or relatively stable year-over-year, it has trended upward since Q4 2015 – we’ll want to stay close to these trends. That said, much of the increase in the percentage of 60-day delinquent automotive loans is a result of a higher percentage of deep subprime loans from previous years – high-risk originations that become delinquent often occur more than 16 months after the origination. Additionally, the percentage of deep subprime originations has steadily decreased over the past two years, which could lead to a positive impact on the percentage of delinquent automotive loans. Despite rising automotive loan amounts and monthly payments, the data shows consumers appear to be making their payments on-time – an encouraging sign for automotive lenders. That said, lenders will want to continue to keep a close eye on all facets of car buyers’ payment performance moving forward – but it is important to put it into context. A clear understanding of these trends will better position lenders to make the right decisions when analyzing risk and provide consumers with comprehensive automotive financing options. To learn more about the State of the Automotive Finance Market report, or to watch the webinar, click here.

The economy remains steady, maintaining a positive outlook even though the GDP growth slowed in the first quarter. Real estate is holding ground even as rates rise. We’ve reached a 7-year high in 30-year fixed-rate mortgages, which could have a longer-term effect on this market. Bankcard may be reaching its limit — outstanding balances hit $764 billion and delinquency rates continue to rise. While auto originations were flat in Q1, performance is improving as focus moves away from subprime lending. The economy remains steady as we transition from 2017. Keep an eye on inflation and interest rates in regard to their possible short-term economic impact. Learn more about these and other economic trends with the on-demand recording of the webinar. Watch now

For most businesses, the customer experience is at the heart of every strategy. Debt collection shouldn’t be different. Here’s why: 21% of visits to an online debt recovery system were made outside the traditional working hours of 8 a.m. to 8 p.m. Of the consumers who committed to a repayment plan, only 56% did so in a single visit. PricewaterhouseCoopers reported that 46% of consumers use only digital channels to conduct banking, avoiding traditional offline channels. Conversely, data collected by Gallup between 2013 and 2016 showed that 48% of American banking customers would only consider using a bank that offered physical branches. The debt collection process is an often-overlooked opportunity to build customer relationships and loyalty. Leverage data and technology to replace outdated approaches, minimize charge-offs and create environments that value each customer. Learn more>

When discussing automotive lending, it seems like one term is on everyone’s lips: “subprime auto loan bubble.” There’s always someone who claims that the bubble is bursting. But a level-headed look at the data shows otherwise. According to our Q1 2017 State of the Automotive Finance Market report, 30-day delinquencies dropped and subprime auto lending reached a 10-year record low for Q1. The 30-day delinquency rate dropped from 2.1 percent in Q1 2016 to 1.96 percent in Q1 2017, while the total share of subprime and deep-subprime loans dropped from 26.48 percent in Q1 2016 to 24.1 percent in Q1 2017. The truth is, lenders are making rational decisions based on shifts in the market. When delinquencies started to go up, the lending industry shifted to more creditworthy customers. This is borne out in the rise in customers’ average credit scores for both new and used vehicle loans: The average customer credit score for a new vehicle loan rose from 712 in Q1 2016 to 717 in Q1 2017. The average customer credit score for a used vehicle loan rose from 645 in Q1 2016 to 652 in Q1 2017. In a clear indication that lenders have shifted focus to more creditworthy customers, super prime was the only risk tier to grow for new vehicle loans from Q1 2016 to Q1 2017. Super-prime share moved from 27.4 percent in Q1 2016 to 29.12 percent in Q1 2017. All other risk tiers lost share in the new vehicle loan category: Prime — 43.36 percent, Q1 2016 to 43.04 percent, Q1 2017. Nonprime — 17.83 percent, Q1 2016 to 16.96 percent in Q1 2017. Subprime — 10.64 percent, Q1 2016 to 10.1 percent in Q1 2017. For used vehicle loans, there was a similar upward shift in creditworthiness. Prime and super-prime risk tiers combined for 47.4 percent market share in Q1 2017, up from 43.99 percent in Q1 2017. At the low end of the credit spectrum, subprime and deep-subprime share fell from 34.31 percent in Q1 2016 to 31.27 percent in Q1 2017. The upward shift in used vehicle loan creditworthiness is likely caused by an ample supply of late model used vehicles. Leasing has been on the rise for the past several years (and is at 31.06 percent of all new vehicle financing today). Many of these leased vehicles have come back to the market as low-mileage used vehicles, perfect for CPO programs. Another key indicator of the lease-to-CPO impact is the rise in used vehicle loan share for captives. In Q1 2017, captives had 8.3 percent used vehicle loan share, compared with 7.2 percent in Q1 2016. In other findings: Captives continued to dominate new vehicle loan share, moving from 49.4 percent in Q1 2016 to 53.9 percent in Q1 2017. 60-day delinquencies showed a slight rise, going from 0.61 percent in Q1 2016 to 0.67 percent in Q1 2017. The average new vehicle loan reached a record high: $30,534. The average monthly payment for a new vehicle loan reached a record high: $509. For more information regarding Experian’s insights into the automotive marketplace, visit https://www.experian.com/automotive.

A recent Experian study found that the amount of time it’s taking for automotive loans opened in Q4 2015 to become delinquent is actually similar to the pace in 2008. When looking at the 60+ DPD rate across all risk levels, the delinquency rate for accounts opened in Q4 2015 reached 0.50% within 6 months, compared with 0.51% for accounts opened in Q4 2008. Lenders can design more effective strategies by using analytics to gain insight into the latest trends and target the right customers. Video: Auto Acquisition Strategies>

This summer, the Consumer Financial Protection Bureau (CFPB) took a significant step toward reforming the regulatory framework for the debt collection industry. The focus is fueled in part by the large number of consumer complaints the CFPB receives about the debt collection market — roughly 35% of total complaints. Here are highlights from the recent CFPB proposal: Data quality: Collectors would be required to substantiate claims that a consumer owes a debt in order to begin collection Communication frequency: Collectors would be limited to six emails, phone calls or mailings per week, including unanswered calls and voice mails Waiting period: Reporting a person’s debt would be prohibited unless the collector has communicated directly with the consumer first The CFPB said its proposal will affect only third-party debt collectors; however, it may consider a separate set of proposals for first-party collectors. >> Insights into CFPB's latest debt collection proposal

According to the latest Experian-Oliver Wyman Market Intelligence Report, mortgage originations increased 25% year over year in Q1 2015 to $316 billion.
According to a recent Experian analysis, bankcard balances increased 6% year over year to $629 billion in Q1 2015, while delinquencies remained low with 60–89 day-past-due delinquencies declining 8%.
According to Experian’s latest State of the Automotive Finance Market report, auto loan balances reached an all-time high of $905 billion in the first quarter of 2015.