Loading...

State of Credit: 10 Year Lookback

by Stefani Wendel 4 min read May 20, 2019

State of Credit Experian 2019

It’s been over 10 years since the first rumblings of Great Recession started in 2008. Today, Americans are experiencing high levels of consumer confidence, marked by high employment rates and increasing credit balances over last year. What have we learned over the last decade? And how do we compare to our behaviors then?

Experian released the 9th annual state of credit report, which provides a comprehensive look at the credit performance of consumers across America by highlighting consumer credit scores and borrowing behaviors.

Who’s faring the best since the recession? According to the data, younger consumers.

“We’re continuing to see the positive effects of economic recovery, especially among younger consumers,” said Michele Raneri, Vice President of Analytics and Business Development at Experian. “Since the recession, responsible credit card behaviors and lower debt among younger consumers is driving an upward trend in average credit scores across the nation. Over the last ten years, those 18 – 21 increased their credit scores by 23 points on average compared to those 18-21 ten years ago.”

As a whole, 2018 was a year marked by financial reform, consumer protection and the return of volatility for the financial markets. A large portion of the analytics from this year’s report took a close look at the credit behaviors of today and compared them to 2008, the year the US headed into the worst recession in 80 years.

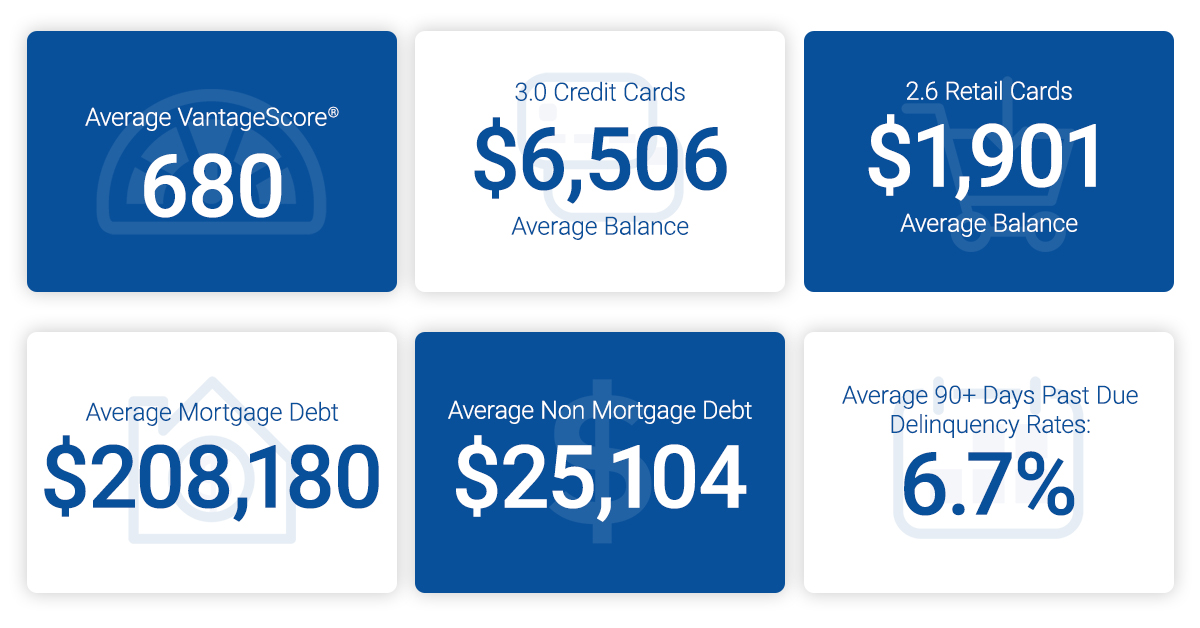
10-Year Lookback 2008 2017 2018
Average number of credit cards 3.40 3.06 3.04
Average credit card balances $7,101 $6,354 $6,506
Average number of retail credit cards 3.03 2.48 2.59
Average retail credit card balances $1,759 $1,841 $1,901
Average VantageScore® credit score [1,2] 685 675 680
Average revolving utilization 28% 30% 30%
Average non-mortgage debt $23,929 $24,706 $25,104
Average mortgage debt $191,357 $201,811 $208,180
Average 30 days past due delinquency rates 5.4% 4.0% 3.9%
Average 60 days past due delinquency rates 2.9% 1.9% 1.9%
Average 90+ days past due delinquency rates 7.1% 7.3% 6.7%

In regards to credit scores, the average VantageScore® credit score increased 5 points from last year, reaching 680 , while still down from 2008.

Segmented by state and gender, Minnesota had the highest credit scores for both men and women. Data also showed that women had higher credit scores than men, consistent with 2017 and 2008.

The past year has been flooded with headlines illustrating increased spending for American consumers. How do the numbers compare with 2008 data? In comparison with 10 years ago, the number of retail trades since 2008 are down, while average balance is up, according to Experian’s State of Credit Report. Additionally, the number of credit cards is down for all age groups, and balance is also down for consumers 22-71 years of age.

Average revolving utilization has creeped up in the past decade, but only two percentage points from 28% to 30%, while both average non-mortgage and mortgage debt has increased 5% and 9% respectively. Not surprisingly, the report reflects that delinquency rates have also increased over 20% since 2008, though down from last year.

In conclusion, there’s a lot to learn from both 2008 and 2018. One of the most important and resonating takeaways might be that while fortune may not seem to favor the young, younger consumers are exhibiting responsible behaviors and higher credit scores, setting a precedence for consistent and better financial health in the future.

Learn more

Experian Boost can help consumers instantly improve their credit score by incorporating their positive payment history from utility and phone bills, among other consumer-permissioned data.

[1] VantageScore® is a registered trademark of VantageScore Solutions, LLC.

[2] VantageScore® credit score range is 300-850

Calculated on the VantageScore® model. Your VantageScore® credit score from Experian indicates your credit risk level and is not used by all lenders, so don’t be surprised if your lender uses a score that’s different from your VantageScore® credit score.

Related Posts

Model inventories are rapidly expanding. AI-enabled tools are entering workflows that were once deterministic and decisioning environments are more interconnected than ever. At the same time, regulatory scrutiny around model risk management continues to intensify. In many institutions, classification determines validation depth, monitoring intensity, and escalation pathways while informing board reporting. If classification is wrong, every downstream control is misaligned. And, in 2026, model classification is no longer just about assigning a tier, but rather about understanding data lineage, use case evolution, interdependencies, and governance accountability in a decentralized, AI-driven environment. We recently spoke with Mark Longman, Director of Analytics and Regulatory Technology, and here are some of his thoughts around five blind spots risk and compliance leaders should consider addressing now. 1. The “Set It and Forget It” Mentality The Blind Spot Model classification frameworks are often designed during a regulatory remediation effort or inventory modernization initiative. Once documented and approved, they can remain largely unchanged for years. However, model risk management is an ongoing process. “There’s really no sort of one and done when it comes to model risk management,” said Longman. Why It Matters Classification is not merely descriptive, it’s prescriptive. It drives the depth of validation, the frequency of monitoring, the intensity of governance oversight and the level of senior management visibility. As Longman notes, data fragmentation is compounding the challenge. “There’s data everywhere – internal, cloud, even shadow IT – and it’s tough to get a clear view into the inputs into the models,” he said. When inputs are unclear, tiering becomes inherently subjective and if classification frameworks are not reviewed regularly, governance intensity can become misaligned with real exposure. Therefore, static classification is a growing risk, especially in a world of rapidly expanding AI use cases. In a supervisory environment that continues to scrutinize model definitions, particularly as AI tools proliferate, a dynamic, periodically refreshed classification process can demonstrate institutional vigilance. 2. Assuming Third-Party Models Reduce Governance Accountability The Blind SpotThere is often an implicit belief that vendor-provided models carry less governance burden because they were developed externally. Why It Matters Vendor provided models continue to grow, particularly in AI-driven solutions, but supervisory expectations remain firm. “Third-party models do not diminish the responsibility of the institution for its governance and oversight of the model – whether it’s monitoring, ongoing validation, just evaluating drift model documentation,” Longman said. “The board and senior managers are responsible to make sure that these models are performing as expected and that includes third-party models.” Regulators consistently emphasize that institutions remain responsible for the outcomes produced by models used in their decisioning environments, regardless of origin. If a vendor model influences credit approvals, pricing, fraud decisions, or capital calculations, it directly affects customers, financial performance and compliance exposure. Treating third-party models as inherently lower risk can also distort internal tiering frameworks. When vendor models are under-classified, validation depth and monitoring rigor may be insufficient relative to their true impact. 3. Limited Situational Awareness of Model Interdependencies The Blind Spotfeed multiple downstream models simultaneously. Why It Matters Risk often flows across interdependencies. When upstream models degrade in performance or introduce bias, downstream models inherit that exposure. If multiple material decisions depend on the same data transformation or feature engineering process, concentration risk emerges. Without visibility into these dependencies, tiering assessments may underestimate cumulative risk, and monitoring frameworks may fail to detect systemic vulnerabilities. “There has to be a holistic view of what models are being used for – and really somebody to ensure there’s not that overlap across models,” Longman said. Supervisors are increasingly interested in understanding how model risk propagates through business processes. When institutions cannot articulate how models interact, it raises broader concerns about situational awareness and control effectiveness. Therefore, capturing interdependencies within the classification framework enhances more than documentation. It enables more accurate tiering, more targeted monitoring and more informed governance oversight. 4. Excluding Models Without Defensible Rationale The Blind SpotGray-area tools frequently sit outside formal inventories: rule-based engines, spreadsheet models, scenario calculators, heuristic decision aids, or emerging AI tools used for analysis and summarization. These tools may not neatly fit legacy definitions of a “model,” and so they are sometimes excluded without robust documentation. Why It Matters Regulatory definitions of “model” have broadened over time. What creates risk is the absence of defensible reasoning and documentation. Longman describes the risk clearly: “Some [teams] are deploying AI solutions that are sort of unbeknownst to the model risk management community – and almost creating what you might think of as a shadow model inventory.” Without visibility, institutions cannot confidently characterize use, trace inputs, or assign appropriate tiers, according to Longman. It also undermines the credibility of the official inventory during examinations. A well-governed program can articulate why certain tools fall outside model risk management scope, referencing documented criteria aligned with regulatory guidance. Without that evidence, exclusions can appear arbitrary, suggesting gaps in oversight. 5. Inconsistent or Subjective Classification Frameworks The Blind SpotAs inventories scale and governance teams expand, classification decisions are often distributed across reviewers. Over time, discrepancies can emerge. Why It Matters Inconsistency undermines both risk management and regulatory confidence. If two models with comparable use cases and impact profiles are assigned different tiers without clear justification, it signals that the framework is not being applied uniformly. AI adds even more complexity. When it comes to emerging AI model governance versus traditional model governance, there’s a lot to unpack, says Longman: “The AI models themselves are a lot more complicated than your traditional logistic or multiple regression models. The data, the prompting, you need to monitor the prompts that the LLMs for example are responding to and you need to make sure you can have what you may think of as prompt drift,” Longman said. As frameworks evolve, particularly to incorporate AI, automation, and new regulatory interpretations, institutions must ensure that changes are cascaded across the entire inventory. Partial updates or selective reclassification introduce fragmentation. Longman recommends formalizing classification through a structured decision tree embedded in policy to ensure consistent outcomes across business units. Beyond clear documentation, a strong classification program is applied consistently, measured objectively, and periodically reassessed across the full portfolio. BONUS – 6. Elevating Classification with Data-Level Visibility Some institutions are extending classification discipline beyond models to the data layer itself. Longman describes organizations that maintain not only a model inventory, but a data inventory, mapping variables to the models they influence. This approach allows institutions to quickly assess downstream effects when operational or environmental changes occur including system updates or even natural disasters affecting payment behavior. In an AI-driven environment, traceability may become a competitive differentiator. Conclusion Model classification is foundational. It determines how risk is measured, monitored, escalated, and reported. In a rapidly evolving regulatory and technological environment, it cannot remain static. Institutions that invest now in transparency, consistency, and data-level visibility will not only reduce supervisory friction – they will build a governance framework capable of supporting the next generation of AI-enabled decisioning. Learn more

by Stefani Wendel 4 min read March 20, 2026

  Experian Verify is redefining how lenders streamline income and employment verification; a value clearly reflected in Marcus Bontrager’s experience at Freedom Mortgage. With access to the second-largest instant payroll network in the U.S., Experian Verify connects lenders to millions of unique employer records, including those sourced through Experian Employer Services clients, delivering instant results at scale. This reach enables lenders to reduce manual processes, accelerate loan decisions, and enhance the borrower experience from the very first touchpoint. Unlike traditional verification providers, Experian Verify offers transparent, value-driven pricing: it charges only when a consumer is successfully verified, not simply when an employer record is found. As lenders navigate increasing compliance requirements and secondary market expectations, they can also rely on Experian Verify’s FCRA-compliant framework, fully supporting both Fannie Mae and Freddie Mac. Combined with Experian’s industry-leading data governance and quality standards, lenders gain a verification partner they can trust for accuracy, security, and long-term operational efficiency. Perhaps most importantly, Experian Verify delivers 100% U.S. workforce coverage through its flexible, automated waterfall: instant verification, consumer-permissioned verification, and research verification. This multilayered approach ensures lenders meet every borrower where they are, whether they’re connected to a large payroll provider, a smaller employer, or require additional document-based validation. As Marcus highlights in the video, this comprehensive and configurable design empowers lenders to build verification workflows that truly fit their business needs while enhancing speed, completeness, and borrower satisfaction. Explore Experian Verify

by Ted Wentzel 4 min read February 20, 2026

%%excerpt%% %%page%% Who is renting in 2025 and why it matters. Explore renter demographics, affordability pressures, credit trends and how Experian data helps predict housing risk and demand.

by Manjit Sohal 4 min read February 4, 2026