Apply Automotive Tag
Auto dealers need to move their dealerships forward through hyper-local advertising that helps them connect with the right audiences at the right time.
Subprime originations hit the lowest overall share of the market seen in 11 years, but does that mean people are being locked out car ownership? Not necessarily, according to the Q3 State of the Automotive Finance Market report.To gain accurate insights from the vast amount of data available, it’s important to look at the entire picture that is created by the data. The decrease in subprime originations is due to many factors, one of which being that credit scores are increasing across the board (average is now 717 for new and 661 for used), which naturally shifts more consumers into the higher credit tiers. Loan origination market share are just one of the trends seen in this quarter’s report. Ultimately, examining the data can help inform lenders and help them make the right lending decisions. Exploring options for affordability While consumers analyze different possibilities to ensure their monthly payments are affordable, leasing is one of the more reasonable options in terms of monthly payments. In fact, the difference between the average new lease payment and new car payment usually averages more $100—and sometimes well over—which is a significant amount for the average American budget. In fact, leases of new vehicles are hovering around 30 percent, which is one of the factors that is aiding in new car sales. In turn, this then helps the used-vehicle market, as the high number of leases create a larger supply of quality use vehicles when they come off-lease and make their way back into the market. On-time payments continue to improve As consumer preferences continue to trend towards more expensive vehicles, such as crossovers, SUVs, and pickups, affordability will continue to be a topic of discussion. But consumers appear to be managing the higher prices, as in addition to the tactics mentioned above, 30- and 60-day delinquency rates declined since Q3 2017, from 2.39 percent to 2.23 percent and 0.76 percent to 0.72 percent, respectively. The automotive finance market is one where the old saying “no news is good news” continues to remain true. While there aren’t significant changes in the numbers quarter over quarter, this signals that the market is at a good place in its cycle. To learn more about the State of the Automotive Finance Market report, or to watch the webinar, click here.

There are four reasons why the auto industry should be enthusiastic about the electric vehicle segment’s future.

Where are electric vehicles most popular? During the first half of the year, 3.6 percent of all new registrations in California were EVs.
While electric vehicles remain a relatively niche part of the market, with only 0.9 percent of the total vehicle registrations through June 2018, consumer demand has grown quite significantly over the past few years. As I mentioned in a previous blog post, electric vehicles held just 0.5 percent in 2016. Undoubtedly, manufacturers and retailers will look to capitalize on this growing segment of the population. But, it’s not enough to just dig into the sales number. If the automotive industry really wants to position itself for success, it’s important to understand the consumers most interested in electric vehicles. This level of data can help manufacturers and retailers make the right decisions and improve the bottom line. Based on our vehicle registration data, below is detailed look into the electric vehicle consumer. Home Value Somewhat unsurprisingly, the people most likely to purchase an electric vehicle tend to own more expensive homes. Consumers with homes valued between $450,000-$749,000 made up 25 percent of electric vehicle market share. And, as home values increase, these consumers still make up a significant portion of electric vehicle market. More than 15 percent of the electric vehicle market share was made up by those with homes valued between $750,000-$999,000, and 22.5 percent of the share was made up by those with home values of more than $1 million. In fact, consumers with home values of more than $1 million are 5.9 times more likely to purchase an electric vehicle than the general population. Education Level Breaking down consumers by education level shows another distinct pattern. Individuals with a graduate degree are two times more likely to own an electric vehicle. Those with graduate degrees made up 28 percent of electric vehicle market share, compared to those with no college education, which made up just 11 percent. Consumer Lifestyle Segmentation Diving deeper into the lifestyles of individuals, we leveraged our Mosaic® USA consumer lifestyle segmentation system, which classifies every household and neighborhood in the U.S. into 71 unique types and 19 overachieving groups. Findings show American Royalty, who are described as wealthy, influential couples and families living in prestigious suburbs, led the way with a 17.8 percent share. Following them were Silver Sophisticates at 11.9 percent. Those in this category are described as mature couples and singles living an upscale lifestyle in suburban homes. Rounding out the top three were Cosmopolitan Achiever, described as affluent middle-aged and established couples and families who enjoy a dynamic lifestyle in metro areas. Their share was 10.1 percent. If manufacturers and retailers go beyond just the sales figures, a clearer picture of the electric vehicle market begins to form. They have an opportunity to understand that wealthier, more established individuals with higher levels of education and home values are much more likely to purchase electric vehicles. While these characteristics are consistent, the different segments represent a dynamic group of people who share similarities, but are still at different stages in life, leading different lifestyles and have different needs. As time wears on, the electric vehicle segment is poised for growth. If the industry wants to maximize its potential, they need to leverage data and insights to help make the right decisions and adapt to the evolving marketplace.
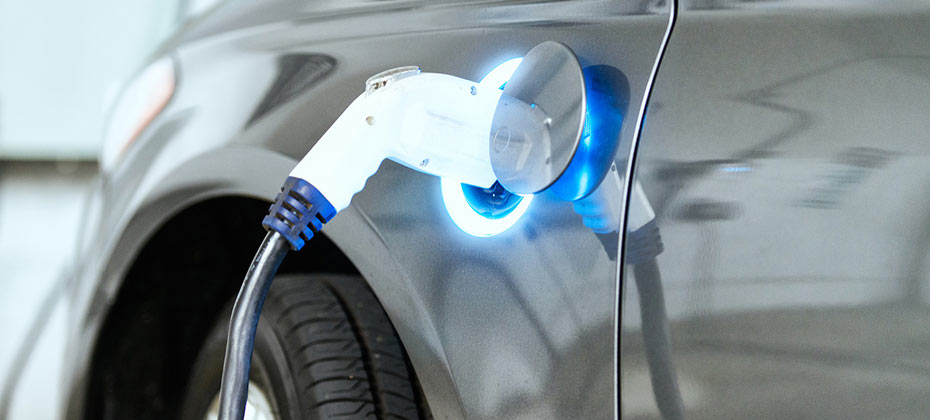
Electric vehicles are here to stay – and will likely gain market share as costs reduce, travel ranges increase and charging infrastructure grows.

Vehicle prices are going up, yet consumers seem unfazed. Despite consumers taking out larger loan amounts, they continue to make their monthly payments on time. But, affordability remains a point of industry interest. As vehicle prices hit record highs, how long will consumers have an appetite for them? According to Experian’s latest State of Automotive Finance Market report, delinquency rates continued a downward trend, as 30- and 60-day delinquencies were 2.11 and 0.64 percent, respectively, at the end of Q2. Those numbers demonstrate that car owners are making timely payments despite rising vehicle costs, which is an encouraging sign for the market. The average loan amount for a new vehicle is now $30,958, a $724 increase from last year. Additionally, consumers are now making monthly payments of about $525 on a new car loan, an all-time high that has seen a $20 year over year increase. The auto market shows little to no sign of declining costs, but vehicles aren’t the only cost to consider – interest rates have increased by 56 basis points since last year. When combined with the rising manufacturer costs, long-term affordability is a continued concern within the industry. The data points to consumers offsetting the expense by taking out longer loan terms. In Q2, the most common loan length was 72 months—which equates to six years—for both new and used financing. While this lowers the monthly payment, it leaves them subject to paying higher interest over time, as well as the potential for individuals to be upside down on their loan for a longer period of time. The key takeaway from this data is that costs continue to rise, but consumers appear to be doing a better job of managing their finances. This insight can help OEMs, dealers, and lenders make strategic decisions with a better understanding of consumer borrowing and credit habits, and think about how to make car ownership more inviting, through incentive or loyalty programs. For consumers, continuing to take steps to actively improve your credit score is one of the key ways to ensure that you’re able to negotiate the right deal when it comes to financing. Ultimately, for everyone involved, it comes down to leveraging the power of data to make more informed decisions, which can help make vehicle ownership more accessible and affordable. To learn more about the State of the Automotive Finance Market report, or to watch the webinar, click here.

In the aftermath of Hurricane Florence, Experian is here to help. As a first line of defense against purchasing a flood-damaged vehicle, people can download our free Vehicle Flood Risk Check app.

Trivia question: Millennials don’t purchase new vehicles. True or False?

When it comes to driving the automotive industry forward, Experian Automotive has a motto: “The right cars. The right customers. The right data to know the difference.” We deliver an integrated perspective based on the highest quality automotive information and market intelligence. Data is important to us, and we have the most robust combination of data assets under one roof. The North American Vehicle Database℠, File One℠ Credit Database, Consumer View℠ Marketing Database, Online Activity Databases, and National Fraud Database℠ all fed into Experian’s Auto HyperConnect™. Auto HyperConnect houses two different solutions: Auto HyperTargeting™ and Auto HyperMonitoring™. There are four different components to Auto HyperTargeting, and the one we will focus on today is Expired Lease. Dealers have found success marketing to their own customers when vehicle leases come due. The challenge has been conquesting off-lease consumers who didn’t buy from them. While off-lease consumer marketing lists are available, they only provide the estimated lease end date and monthly lease payment. When restricted to this data, it’s hard to tell if a $550 a month payment is for a Ford F150 or a BMW 3-series. And yet this is exactly the level of detail needed to successfully target off-lease marketing. Experian’s new Auto HyperTargeting- Expired Lease addresses this challenge by enabling dealers to identify and engage off-lease audiences through a highly targeted approach that has never been possible! Now, finding customers is much easier and cost-effective. You can use the best mix of selection criteria to maximize your off-lease conquesting strategy. Some of the ways you can identify your audience are: Lease Maturity Date Vehicle Make Vehicle Model Zip Code Model Performance Tier Distance from Dealer Ship Vehicle Status (New or Used) Signing up for Auto HyperTargeting- Expired Lease comes with five perks. The first is a monthly file. This includes name and address, lease maturity date, make/model, monthly payment bands, and phone and email address when available. The second is the ability to make sign up for a subscription monthly payments. Third is marketing flexibility with direct mail, email, and phone. Four there is no firm offer of credit required for this. Finally, a quarterly sales report. ARA reports provide sales metrics industry wide for your targets. Other competitive features also available in Auto HyperTargeting- Expired Lease is the customers full contact information with name, address, email address and phone number. And for online and offline channels, you can select a specific audience that is customizable. Auto HyperTargeting has some amazing features to successfully conquest customers, and Expired Lease is one of the four ways to do this. Stay tuned for Auto HyperTargeting- Vehicle Owners coming up next!

In our previous post, we talked about Experian’s 2018 Attribution Study. This study is a wide-ranging, dealer-focused sales-driven attribution study to answer the question of what drives sales. Three takeaways were formed and the first was looking at shopper behavior instead of isolated KPIs. Now, we look at the second and third takeaways. Optimize your paid advertising Paid search is an important part of dealership marketing and precise targeting will help with both traffic and purchasing rate. Branded search drives quality traffic to websites. 7% of all traffic and 12% of HVU traffic comes from branded search. Along with traffic, the purchase rate was found to be 54% higher than average. In terms of value, New Make and Model has impressive results. 2% of all traffic and 12% of HVU traffic comes from New Make and Model. The purchase rate is 137% higher than average. Of note, we found that in order to optimize paid search to drive sales, you must buy your own name. 100% of dealers studied had buyers via branded search. With that, optimized “New Make Model” campaigns are crucial. 82% of dealers had buyers come through Make Model keywords. Traditionally, New Make Model would just create a higher funnel but since we are in the digital age, this does not happen anymore. Some participating dealers spent <20% of search budget on New Make Model campaigns. A key point is that no dealer had buyers come through via competitors’ keywords. As for a dealer’s website, display leasing offers and content for buyers since many search queries contained lease keywords. Although paid search is important, there are other channels to optimize and segmentation is key. This study found that conquesting with bulk email-blasts is not effective. You can achieve better email marketing results by targeting shoppers more intelligently and using quality lists. CRM-driven loyalty campaigns performed well in this segment. Display campaigns revealed that social media is no longer just for posting content but paid social advertising campaigns were effective. In fact, this study found Facebook display to be more effective than Google and other display networks. The reason is it is easier to segment and target a specific audience through Facebook. Google is more difficult to segment and has too many set-it-and-forget-it campaigns. Evaluate your third-party investments This brings us to third-parties, such as Automotive Shopping Portals and other lead providers. Performance with third-parties can vary and dealers should evaluate third-party performance as it relates to your sales. The third-party buy rate was under-indexed for dealers versus all sales. The business model for third-parties is not focused on driving traffic to dealer sites. Since there are so many vehicles listed on third-party sites from franchises, independent dealers, and private parties, there is a lot of “noise” for customers to sift through. For dealers, finding out what drives sales has led to Experian's 2018 Attribution. Our wide-ranging, dealer focused sales-driven attribution study focused on key variables and delivers three recommendations: Focus on website shopper behavioral metrics to drive sales. optimize paid search, specifically branded search and new make model campaigns. and evaluate third-party performance as it relates to your sales. With these, a dealer can be more confidant with their marketing and their data.

There are many factors attributing to the success of dealerships. When it comes to dealers, empirical guidance is a great way to study effective advertising. Experian brought Auto, Targeting, and the Dealer Positioning System capabilities together in a nationwide study to answer the ultimate question: what drives sales? The answers can be found in Experian’s 2018 Attribution Study. This is a wide-ranging, dealer-focused sales-driven attribution study that analyzed a few key variables. We deployed 187,701 tracking pixels to devices in 41,012 distinct households, focused on 15 digital metrics to learn about shopper behavior, and tied that digital shopping data to 2,436 vehicle sales. An industry first, Experian’s ability to combine automotive registration data, sales data, and website analytics and online behavior data puts us in a position to do something that very few companies can do. We use the household identifiers to not only see who bought a car and who bought specifically from a participating dealer, but also how they shopped the dealer’s site. Our ability to accurately identify a household’s digital behavior is based on the fact that we are a source compiler of the data and have it sitting under one roof. Others that attempt to provide this type of insight need to contract out for registrations, sales data imports from the dealership, website analytics, household identifiers, or all the above, which generally adds time to the insights. Using our sales-based approach, we can deliver unbiased attribution. Sales-based attribution is attributing credit to different advertising sources/campaigns based on actual vehicle sales – including those targeted consumers that may have purchased outside of the dealership. This is the Holy Grail of attribution for car dealers since it ties an offline activity such as buying a car back to the online advertising that’s taking up most their budgets every month. Because of that offline-online disconnect, sales-based attribution is difficult. Other automotive attribution models are typically focused on website conversions or website behavior – “what advertising can I attribute website leads to” (conversions) or “what advertising is driving users who follow the behavior that I think shows they’re likely to buy from my dealership” (website behavior.) What are the takeaways? We found three takeaways from our study. First off, we look at shopper behavior instead of isolating KPIs. Later we will discuss how traditional website metrics do not tie-in to sales. Second, we look at optimizing your paid advertising. Finally, we look at third-party investments. Although third parties drive sales, they may not be your sales. Looking at shopper behavior, not isolated KPI’s Traditional website metrics don’t tell the sales story for dealers. Traditional conversion stats are equal for buyers vs. all traffic such as VDPs or page views What this means is on average, buyers converted at a lower rate than overall website traffic. Looking solely at form submissions, hours and directions pageviews, and mobile clicks-to-call, don’t give the best view of what advertising is driving sales. With that, 98% of buyer traffic never submitted a form or went to the hours and directions page. This is a typical website conversion that dealers, vendors, and advertising agencies focus on. Since traditional web metrics don’t tell the story, there is another way. These are called High-Value Users, or HVU. They purchase at a 34% higher rate than overall traffic although they make up 11% of all traffic. High-Value Users are an Experian derived KPI. What makes someone an HVU are four different measurements. They must visit a website at least three times Spend at least six minutes on the site in total View at least eight pages in total View at least one VDP High-Value Users correlates to sales better than Vehicle Detail Page or VDP metrics. In this study, the correlation for VDP was measured at .595 which is rated a medium correlation. Meanwhile, HVU scored a .698 which is rated a high correlation. Looking at many different behavioral KPIs, like we do with our High-Value User (HVU) metric, correlates better to sales than just looking at how many VDPs you had. Driving more VDPs won’t necessarily help sales. But driving more HVUs is more likely to correlate with more sales. This also gets back to the attribution discussion above: Experian sales-based attribution is the best, and Experian’s HVUs are a good method for web-based attribution. From this attribution study, High-Value Users are a vital group for dealers to utilize. In our next post, we will go over the second and third takeaways from the attribution study: optimizing paid advertising and evaluating third-party investments.
When it comes to vehicle history reporting, there are many offerings on the table. Some are better known than others, but only one comes from the global leader in data-driven solutions. AutoCheck® vehicle history reports are backed by Experian Information Solutions and have many key features that competitors don’t have. You and your customers can make more confident decisions knowing that the vehicle’s history is backed by data from Experian. Selling is made easier by providing greater transparency which strengthens consumer confidence in your inventory and brand to sell more cars. Below, we will help you better understand the value of AutoCheck throughout your dealership and take you through the five best practices for using AutoCheck. AutoCheck Best Practice #1: Integrate AutoCheck in all your dealership’s applications and websites. The good thing about AutoCheck is the ease of integration within a dealership’s applications and websites. AutoCheck works with hundreds of software providers, meaning it is highly flexible with whatever your dealership is using. It doesn’t matter if the user is a buyer, manager, technician, or any other role at a dealership. There are no additional costs for multiple users since there is an unlimited number of users for a dealership. If a dealership works with someone that AutoCheck doesn’t already work with, Experian will still set the dealership up and work with them to make sure they have a seamless integration. AutoCheck Best Practice #2: Run an AutoCheck on every vehicle acquisition. Since AutoCheck is a vehicle history reporting software, it can uncover unknown history that could pass off to a dealer or a consumer. AutoCheck checks for multiple owners, title brands, open recalls, previous auction announcements, prior vehicle uses, odometer fraud, accidents and so much more! The reason why this is so important comes down to the number of vehicles in operation. Per NADA Data, there were over 264 million cars and light-duty trucks in operation in the United States in 20161. If approximately 20% of the cars and light-duty trucks on the road have been in an accident, that is over 50 million vehicles currently on the road that have been in an accident². The average diminished value of a vehicle in an accident is $3,0193. Finding only one accident per month you did not know about justifies and pays for the cost of an AutoCheck subscription. AutoCheck Best Practice #3: Promote your inventory with AutoCheck. AutoCheck can also be used to directly promote a dealer’s inventory. All a dealer does is integrate AutoCheck with their dealership’s website. An AutoCheck link is automatically added to every vehicle. There is no additional charge which provides savings to both the dealer and the consumer. The most current data is provided with every click to give feedback to dealers. AutoCheck is the only vehicle history provider on all the top online shopping sites. Consumers can look for AutoCheck on Autotrader℠, Cars.com™, CarGurus®, ebay™ Motors, Edmunds®, and Kelly Blue Book®. AutoCheck Best Practice #4: Build confidence in every sale with AutoCheck. The patented AutoCheck Score is a numerical rating summarizing the events about the vehicle. This helps dealers and consumers to compare vehicles of similar class and age based on a scale of 1 to 100. It also predicts the likelihood the car will be on the road in 5 years. The Score helps to understand a vehicle’s reliability as it pertains to the vehicle’s age, number of owners and accidents. When comparing two vehicles, it is also important to look at the Similar Vehicles Score. Even though a vehicle may have a score of 89 compared to a similar vehicle which scored an 85, the first vehicle may have a score range of 91-96. This would mean the vehicle that scored an 89 is lower than the average. The AutoCheck Score is based on many variables including age, vehicle class, mileage, number of owners, and vehicle use and event. Along with the AutoCheck Score, the BuyBack Protection program from AutoCheck will help build confidence. Experian will buy back a vehicle if the AutoCheck report fails to list certain brands available to Experian at the time the report was issued. This program is up to 110% of NADA Guides retail value, plus up to $500 in aftermarket accessories. Registered and qualified vehicles have this protection available at no cost and will have a badge on their report. AutoCheck Best Practice #5: Promote your service department by providing service data. The final aspect and best practice focuses on the service department and service data. Dealers can display services they have performed within AutoCheck. With AutoCheck, dealers and consumers can see that a vehicle has been well maintained with reported service data. Reporting service data provides an easy to understand format for customers and builds confidence for shoppers. All-in-all, AutoCheck can be used in every department successfully. To recap, these are the five best practices for AutoCheck. Integrate AutoCheck in all your dealership’s applications and websites. Run an AutoCheck on every vehicle. Promote your inventory with AutoCheck. Build consumer confidence in every sale with AutoCheck. Promote your service department and display service records on AutoCheck. ¹Source: NADA DATA, Annual General Overview 2016, page 3. https://www.nada.org/2016NADAdataHighlights/ ²Source: Experian Analysis, more than 18 % of cars and light duty trucks in operation have been in an accident. 3Source: Mitchell Industry Trends Report, Q1 2017, page 32 http://www.mitchell.com/Portals/0/Assets/industry-trends/itr-vol-17-no-1-winter-2017-apd.pdf

Data driven insights about your marketplace are critical to your success. For instance, data can be used to determine if your customers are loyal or if they are likely to defect to another dealership. According to Experian research, there were 54 million consumer vehicle sales transactions in 2017. While that may sound great, not all returning buyers are loyal. In fact, we found that three out of four people are not dealer loyal. Even though only ¼ of a dealer’s customer base regularly return, the remaining ¾ can be conquested. 41 million non-dealer loyal vehicle sales happened in 2017, meaning there were 41 million chances to conquest for dealers across the country. You may be asking yourself “that’s interesting, but how do I win?”. Start with best in class data. At Experian, we work with our North American Vehicle Database℠, File One℠ Credit Database, and Consumer View℠ Marketing Database. These databases have information including the history of 900 million vehicles in the United States and Canada, 10 billion vehicle history records, to consumer data about credit inquiries and data attributes for consumers and households. Figuring out how to increase customer loyalty and conquesting becomes simple once you consider Experian’s solution: Auto HyperConnect™. Auto HyperConnect is the answer to the question of “how do I use my data to win my market?” Our Auto HyperConnect suite includes two different products. The first is Auto HyperMonitoring™ which improves customer loyalty. The second is Auto HyperTargeting™, which offers four different ways to conquest vehicle owners: through owners/service, expired leases, off-loan, and current vehicle equity. Since there is a lot to talk about regarding conquesting vehicle owners, this will be a basic overview and we will go into detail later. Experian goes beyond providing quality data to our clients- we are your partner in the discovery of critical information to drive your success. The first step in our Auto HyperTargeting methodology starts with discovery - working with an Experian Automotive representative to create the most effective conquest strategy. After that, quantify and understand what data is available and how similar records have performed historically. Next, execute the strategy by launching campaigns to communicate with prospective customers via direct mail, email, and phone, etc. Finally, measure and track results with quarterly marketing attribution reporting with Experian’s Auto Response Analysis With Auto HyperTargeting, these six product benefits help it to stand apart from the competition: Highly targeted audiences and attributes lists closely fit prospecting profiles. These profiles include geography, vehicle make, vehicle class, and lease maturity data. Append 1,500+ demographic attributes, 650+ psychographics, and 70+ Mosaic segments. Complete, accurate, and actionable data is delivered timely. Data derived from the source with proprietary processes ensure that it’s the highest quality and best coverage. Flexible marketing execution has no firm offer of credit required and customizable messaging for relevancy. Full visibility performance tracking has closed loop ARAs delivered quarterly with performance details. Performance driven audience hyper targeting approach gets dealers the closest to the customer as possible while saving time and money. Focusing on marketing strategy and tactics delivers results and eliminates waste from unproductive volume/cost opportunities. Finally, the competitive advantage takes market share away from the competition by identifying, engaging, and converting the right prospects. Briefly, here are the four different types of conquesting a dealer can do with Auto HyperTargeting: Expired Lease lets a dealer conquest new prospects based on customized input criteria including zip codes, vehicle makes and classes, and lease maturity data with the marketing flexibility necessary to drive engagement and win new customers. There is no firm offer of credit required. Vehicle Owners lets a dealer engage with current owners to enable new relationships and opportunities. These opportunities reach out to service and parts, aftermarket accessories, new/used car, warranty, insurance, and financial services. Vehicle Equity identifies, engages, and acquires new customers with positive vehicle equity status and maximizes sales opportunities. Getting consumers into a new vehicle, into re-finance solutions, into new loans, and get third party offers in front of consumers are all apart of vehicle equity. End of Loan connects dealers with consumers who are reaching the end of their loan term and help them transition into their new vehicle of choice. These include customized offers, getting consumers into a new vehicle, getting consumers into new loans, and getting third party offers in front of consumers. Juggling the requirements to both maintain customer loyalty and conquest for new ones can be difficult, but our Auto HyperConnect suite helps dealers to succeed at both. In our upcoming mini-series on conquesting with Auto HyperTargeting, we will detail it’s four core capabilities in more detail to help dealers to conquest with confidence.