How Credit Unions Can Improve Financial Inclusion

by Corliss Hill 6 min read October 20, 2022

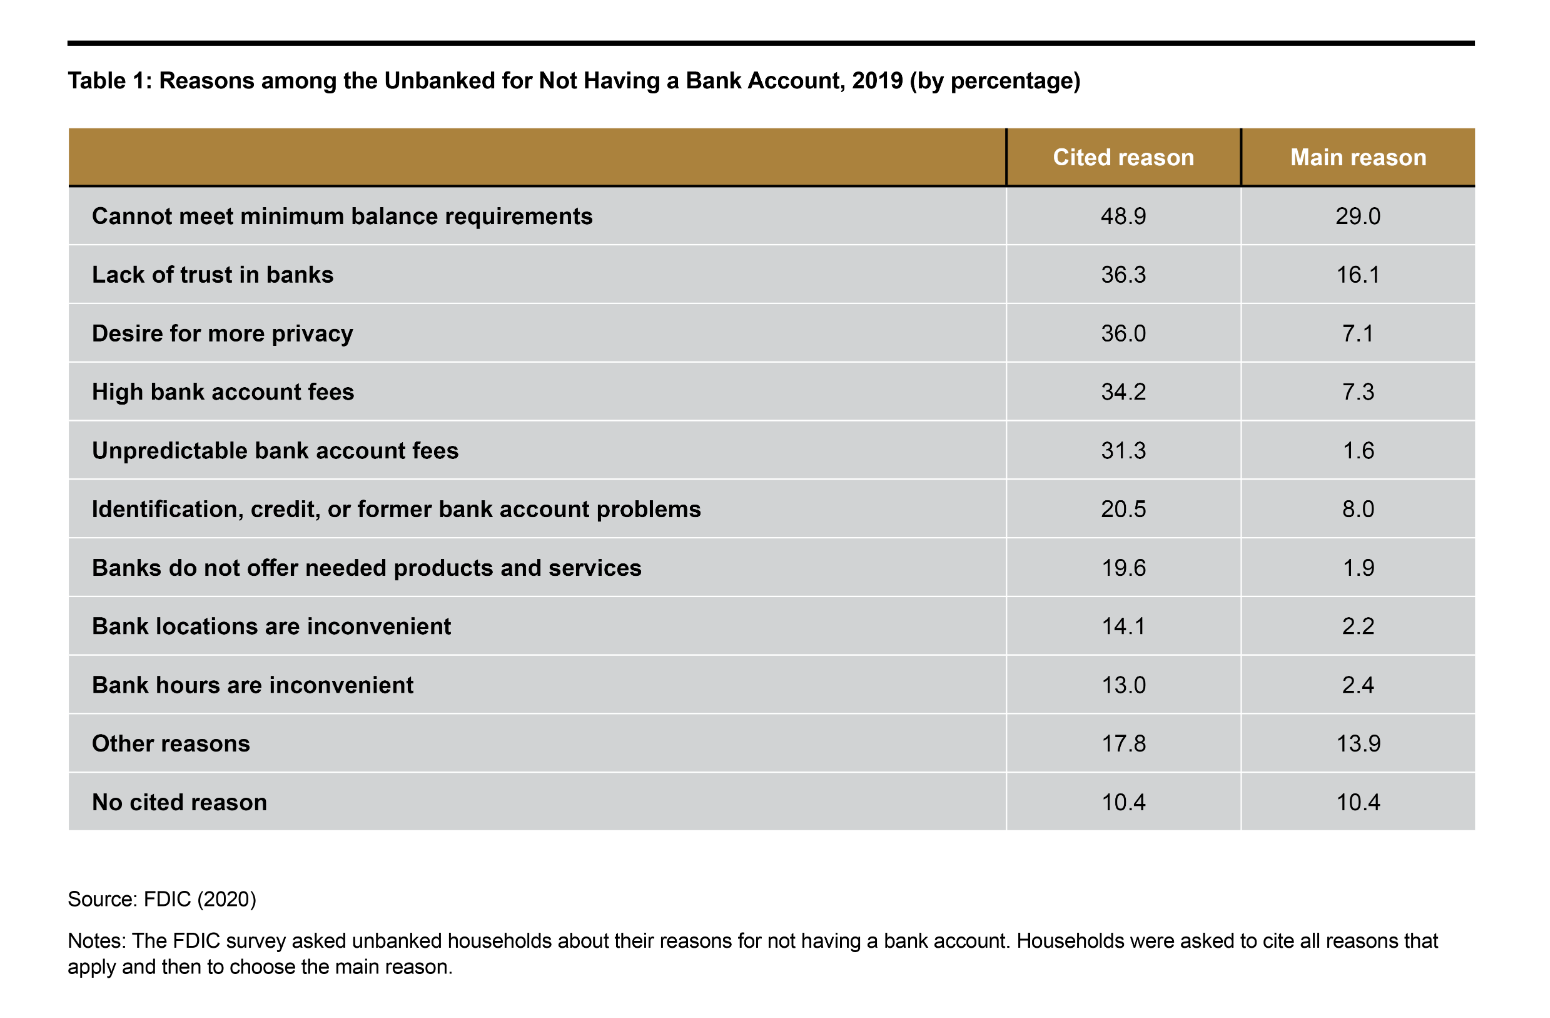
More than seven million Americans who are unbanked cite high account fees, insufficient funds to meet minimum balances and a lack of needed products and services as the main reasons for not having a checking or savings account.1

Credit unions understand that being unbanked comes at a steep cost and have turned their focus to developing products and strategies that prioritize financial inclusion — a movement to combat inequities in banking and better serve the financial needs of marginalized communities.

In 2022, the House passed Expanding Financial Access for Underserved Communities Act to allow federal credit unions to add underserved areas to their fields of membership as a means of improving financial inclusion. “We believe diversity, inclusion, equity, belonging and accessibility has to be weaved into the strategic fabric of an organization [and its] culture,” says Max Villaronga, President and Chief Executive Officer of Raiz Federal Credit Union. “When we don’t participate in [diversity, equity and inclusion], we are complicit in essentially keeping people out of the banking system.”

For credit unions, driving financial inclusion starts with setting a vision that will leave a lasting legacy that includes fostering financial empowerment, closing the credit gap and building generational wealth among the communities they serve. Here’s a roadmap for getting started.

Best practices for engagement

Establishing a set of best practices is the essential starting point for improving financial inclusion. The process begins with the mission statement and extends to all aspects of operations from hiring procedures to sponsorships and donations. Villaronga advocates three strategies for engagement:

Engage the leadership team

Conversations about financial inclusion need to start at the top. The C-suite must be willing to be honest about the barriers and willing to adopt changes that will make credit unions more inclusive.

“[T]hese systemic barriers will exist until somebody deliberately moves them out of the way,” Villaronga says. “The people who are feeling those barriers are not in the position to do the moving it’s up to [CEOs and CFOs] to decide to do something to make a difference.”

Making a difference starts with choosing a leadership team that reflects the demographics of local communities. Case in point: At Raiz Federal Credit Union in El Paso, Texas, senior management and the board have LGBTQIA+ representation and include members from diverse racial and ethnic identities. The board of directors has also prioritized creating a pipeline that will attract more diverse talent to the board.

“Many of [our board members] come from underserved backgrounds in our border community,” Villaronga says. “This is a very personal journey for them because they can see themselves in the lives of the people we’re serving.”

Build trust in underserved communities

According to an FDIC Survey, “unbanked” U.S. households listed a lack of trust in financial institutions as a top reason for not having a bank account. And lack of access to a checking or savings account is most prominent among racial and ethnic minorities and low-income communities.2

Actions speak louder than words, according to Villaronga. Raiz Federal Credit Union uses diverse images in its advertising and provides information in both English and Spanish. The credit union was also awarded the Juntos Avanzamos (Together We Advance) designation from Inclusiv for its commitment to serving and empowering Hispanic communities by providing safe, affordable and relevant financial services.

Villaronga believes that a designation like Juntos Avanzamos sends the message to the community that the credit union is committed to improving general financial literacy and pre-loan education, as well as reducing higher charge-offs and other barriers to accessing financial services that exist in lending and serving underserved communities.

Dispel financial inclusion myths

Among traditional financial institutions, myths about financial inclusion are widespread and include falsehoods that pricing products for marginalized communities are too challenging, reaching out is not profitable, and providing financial products to underserved markets is too risky.

“Credit unions were really built to extend credit [and] were also originally established to serve consumers that were being ignored by the existing systems that were in place but those consumers are still being ignored today,” Villaronga says. “Are those communities too risky to serve? Some companies are serving them [and] they would not be doing so if it was not profitable.”

Raiz Federal Credit Union offers several affordable loan products — from credit builder loans to citizenship loans and payday lender payoff loans along with credit cards — that allow members to build their credit scores and establish positive credit histories.

Rather than pricing loans based on what the competition is charging, Villaronga calculates the fixed and variable costs, failure fraction and target return on assets to get a floor pricing per unit. The approach, he adds, allowed Raiz Federal Credit Union to report earnings of over 150 basis points in 2021 while maintaining a 12 percent capital ratio, proving that financial inclusion is good for the bottom line.

“THE IDEA THAT YOU CANNOT [ACHIEVE FINANCIAL INCLUSION] IN A WAY THAT’S SAFE AND SOUND AND SATISFIES THE [NATIONAL CREDIT UNION ADMINISTRATION] IS TRULY A MYTH.”

– Max Villaronga, President and CEO, Raiz Federal Credit Union

Partner for Success

For credit unions, an important part of achieving financial inclusion goals is identifying partners that can help.

Raiz Federal Credit Union set a goal to increase automated lending from 20 percent to 60 percent, but using a traditional loan origination program was insufficient to hit that target. A partnership with Experian allowed the credit union to access tools that allowed it to better identify non-traditional risks and opportunities, as well as develop more robust lending and optimized decision strategies.

Experian launched Inclusion ForwardTM, an initiative to help boost financial inclusion and close the wealth gap, and support financial institutions by enhancing their inclusion approach by leveraging FCRA-regulated data sources (otherwise known as alternative data).3

In addition to providing a deeper view of unbanked and underbanked consumers and reducing friction and speed of decisioning through increased automation, Experian Lift PremiumTM uses income and employer data, social security and financial management insights — transaction behaviors that were historically credit invisible or unscorable — to help credit unions meet the needs of underserved markets and increase opportunities for inclusion.

“This automation also allows us to reduce our fixed cost per unit — [and] it’s a really big deal because this is not by little, but a lot,” Villaronga says. “This lower cost to produce [a loan] allows us to improve our interest rates to underserved members, further creating an appealing value proposition that’s in line with our financial inclusion strategy.”

Access our case study to learn more about how Experian can help grow your business with a frictionless digital prequalification experience.

1Federal Reserve Bank of Cleveland (May 2022). Unbanked in America: A Review of Literature
2 Federal Deposit Insurance Corporation (December 2021). American Banks: Household use of Banking and Financial Services
3When we refer to “Alternative Credit Data,” this refers to the use of alternative data and its appropriate use in consumer credit lending decisions, as regulated by the Fair Credit Reporting Act. Hence, the term “Expanded FCRA Data” may also apply in this instance and both can be used interchangeably

Related Posts

How Consumer Vehicle Choices Are Shaping Automotive Loan Trends

Conversations about rising auto loan balances and higher monthly payments has often centered around increasing vehicle prices and elevated interest rates; and while those factors have undoubtedly played a role, another important piece of the puzzle is the type of vehicles consumers are choosing to purchase. According to Experian’s Automotive Consumer Trends Report: Q1 2026, consumers are continuing to opt for SUVs over other vehicle types, a trend that may be contributing to higher average loan amounts and monthly payments. SUVs accounted for 63.5% of all new retail vehicle registrations over the last 12 months, up from 62.8% a year ago. Additionally, more than 117 million SUVs were in operation across the United States in the first quarter of 2026, making up 42.2% of the market share. At the same time, traditional passenger cars continue to fall in share, coming in at 16.5%, a decrease from 18.4% last year. As consumers increasingly gravitate towards the larger vehicle segment, it reflects the ongoing desire for versatility, cargo capacity, and family-friendly functionality. Electrification’s growing role in consumer purchasing behavior Interestingly, electrified SUVs continue to gain traction, representing 27.7% of all new SUV registrations, these vehicles include battery-electric, hybrids, plug-in hybrids, and other alternative fuel types. Diving a bit deeper, the Tesla Model Y was the market share leader for new, retail electrified SUV registrations in the last 12 months, coming in at 15.8%. Rounding out the top five were Honda CR-V (9.6%), Toyota RAV4 (7.2%), Chevrolet Trax (7.2%), and Toyota Grand Highlander (3.4%). As model availability and familiarity with the electrification segment grows, the broader adoption of these vehicles are playing an increasingly important role in vehicle pricing and overall consumer demand. While average loan amounts and monthly payments are being driven by a combination of factors such as financing costs and consumer purchasing behavior, data in Q1 2026 demonstrates the continued interest in SUVs. This suggests that the industry’s shift toward larger vehicles is likely playing a meaningful role in today’s financing environment. To learn more about SUV insights, view the full Automotive Consumer Trends Report: Q1 2026 presentation.

Published: June 17, 2026 by Kirsten Von Busch
When New Data Impacts MBS Pricing: Student Loan Debt

In our previous post, we described the Current Second Lien Balance field, which is one of over 2,000 fields in the new Experian Mortgage Loan Performance (MLP) dataset. We showed that the Current Second Lien Balance field meets our three-pronged materiality standard for new data delivery: New: Provides information not available in existing datasets (i.e., orthogonal to currently available data). Material: Impacts a sizeable portion of the MBS universe. Significant: Differentiates collateral performance by a large enough margin to influence trading and risk management decisions. In this article, we discuss another field that satisfies the above criteria: Student Loan Balance.  We evaluate this field in the context of these criteria. First, however, we provide a summary of the MLP dataset and how it compares to standard GSE loan-level data available today. Standard GSE Data vs. Experian Mortgage Loan Performance (MLP) Data The MLP dataset contains thousands of fields describing mortgage performance from each borrower, loan, and property perspective, all refreshed monthly (including, amongst other things, new credit scores and refinance inquiry activity, loan performance, filed junior liens, and AVM values).  MLP differs from loan-level data provided byFreddie Mac, Fannie Mae, and Ginnie Mae, which the vast majority of market participants solely rely on, in a number of ways: Standard data provided by the GSEs and GNMA does not contain all the information necessary for accurate forecasting of mortgage prepayment and credit performance. Basic, critical fields like borrower’s current credit score and current junior liens on the property are missing. The new Mortgage Loan Performance (MLP) dataset from Experian contains borrower, loan, and property data fields covering the entire mortgage universe, including Agency, Non-Agency, and Esoteric mortgage products (CES, HELOC, Reverse), both securitized and non-securitized. MLP enables full three-dimensional (borrower + loan + property) tracking with persistent keys for borrower (before and after refinancing), loan (in securities/deals even after exit due to payoffs or buyouts, including before and after MSR sales), and property.  This enables end-to-end analysis of each borrower’s (and property’s) mortgage experience throughout their credit lifecycle. New, Material and Significant Field:  Student Loan Debt MLP contains a number of fields describing each mortgage borrower’s student debt load, including amounts in repayment, forbearance and collections; estimated interest rate, time remaining until forbearance expiration, and more. In the interest of simplicity, for this article we’ll focus on a single student loan-related field within MLP: Student Loans Balance, which is defined as the total balance on open non-deferred student trades reported in the last 3 months. Is Information Regarding Student Loans New to Markets? Standard loan-level data disclosed by the GSEs and GNMA contain no student-loan-specific fields. Theoretically, fields related to DTI at origination might capture some aspect of student loan debt. So, in the best case scenario for an investor relying solely on standard disclosure, a DTI value as of origination is provided -- yet is never updated as the loan seasons and the borrower’s debt and income change (see more here).  But in the case of federal student loan debt attached to mortgages originated from early 2020 to late 2023, the level of detail provided by disclosure may be even more unknown due to COVID-era repayment and reporting moratoriums. The student loan repayment moratorium was a temporary federal policy that paused required payments, set interest rates to 0%, and suspended collections on most federally-held student loans. The moratorium began in March 2020, with payments resuming in October 2023, making it approximately 3.5 years in duration—the longest consumer credit payment pause in U.S. history. (Source: NCUA ) During the moratorium, student loan-related debt loads may have been understated as federal loans were in a temporary state of $0 repayment.  As an alternative to leaving student loan debt completely out of DTI calculations, an imputed payment equal to only 0.50% of the outstanding balance was often used as a placeholder for a borrower’s DTI calculation. As a result, mortgages originated during the moratorium may have artificially low reported DTIs for borrowers with student loan debt, materially understating true post-moratorium debt .  Accordingly, prepayment risk for these loans is likely overstated in mainstream market models. Standard data only reports information related to the primary mortgage and does not include any details on the borrower’s other debts with the exception of DTI at origination, which is never updated throughout the life of the loan. In contrast, MLP provides a comprehensive view of the borrower’s full credit profile, including other obligations such as credit cards, mortgages on other properties, student loan balances, and much more. Is Student Loan debt material to the residential mortgage market? Approximately $11 trillion of residential mortgage loans were originated during the student loan payment moratorium (Source: Experian MLP Dataset), a period marked by historically low mortgage rates during the COVID era.  As discussed above, DTI data contained in standard market disclosure may be particularly inaccurate for these loans. As the Wall Street Journal recently reported, a new report from the Federal Reserve of New York shows a rise in student loan default rates by age group.  Student l Of today’s $13 trillion in outstanding mortgage debt, more than 10% of that debt ($1.5 trillion) is associated with borrowers who carry student loan debt.  For these borrowers, the average amount of student loan debt outstanding is approximately $50,000, versus a mortgage balance of approximately ~$289,000. In other words, the average student loan debt balance is almost 20% of the mortgage balance for the average borrower who carries both. For this set of borrowers, the average monthly payment is approximately $400 for student loan vs. approximately $2,200 for 1st lien mortgage—so that monthly student loan payments are a significant debt load, approximately 20% of the monthly mortgage payment.  (Source:  Experian MLP Dataset) Is the effect of student loan debt a significant driver of performance? Figure 1 illustrates prepayments by student loan balance for a sample of loans drawn from MLP. The chart illustrates that borrowers with larger student loan balances prepay much more slowly, likely because some are effectively locked out of refinancing once student loan payments resume due to elevated DTI. The debt-to-income (DTI) ratio calculated using actual student loan payments may be significantly higher than the DTI calculated during the moratorium, in some cases exceeding GSE eligibility thresholds. As illustrated in Figure 1, for in-the-money (ITM) collateral, the differential between loans with material student loan balances (greater than $200,000) and loans with no student debt can reach up to 5 CPR. Notably, even for out-of-the-money (OTM) collateral, loans with student debt prepay 1 to 3 CPR slower, likely reflecting reduced mobility due to tighter financing constraints when purchasing a new home. Pools with otherwise similar prepayment characteristics may exhibit different prepayment behavior depending on the distribution of student loan exposure within their collateral. In addition, because loans with student debt tend to prepay more slowly, this effect increases over time due to burnout: loans without student debt prepay and exit the pools more quickly, leaving a higher concentration of slower-paying loans behind.  Given that 10% of the $13 trillion outstanding mortgage market is associated with borrowers who have student loans (Source:  Experian MLP dataset)—and that student loans have a meaningful impact on prepayments—many pools issued between March 2020 and October 2023 may be subject to this student loan debt CPR throttle, and therefore mispriced by investors relying exclusively on standard market data. Fig 1. Prepayment S-Curve: Student Loans Balance Source:  Experian MLP dataset hosted on IVolatility Data-Driven Platform   _____________________________________________________ Michael Pyatski advises MBS traders, portfolio managers, quants, risk managers, loan originators, and technology professionals on making informed, data-driven business decisions that drive revenue growth, enhance risk management, and reduce trading costs. With more than 15 years of experience as an Agency RMBS trader—including serving as Head of the Proprietary Trading Desk at BNP Paribas—Michael developed and successfully implemented relative-value, data-driven profitable trading strategies to capture market opportunities embedded in data but not fully priced by the market. His trading experience, combined with a Ph.D. in econometrics, led him to found the Data-Driven Portal (https://datadrivenportal.com/), a platform that provides advanced technology for MBS trading and risk management. The platform’s No-Model Data-Driven technology leverages big data, econometric analysis, and AI to help traders identify relative-value opportunities in RMBS markets and generate above-market, risk-adjusted returns. _____________________________________________________

Published: June 17, 2026 by Perry DeFelice
Empowering merchants to reduce first-party fraud and chargebacks

Reduce first-party fraud and chargebacks with data-driven strategies that help merchants prevent disputes, protect revenue and improve customer trust.

Published: June 15, 2026 by Charles Hunter