Tag: data

Today is National Fintech Day – a day that recognizes the ever-important role that fintech companies play in revolutionizing the customer experience and altering the financial services landscape. Fintech. The word itself has become synonymous with constant innovation, agile technology structures and being on the cusp of the future of finance. Fintech challengers are disrupting existing financial models by leveraging data, advanced analytics and technology – both inspiring traditional financial institutions in their digital transformation strategies and giving consumers access to a variety of innovative financial products and services. But to us at Experian, National Fintech Day means more than just financial disruption. National Fintech Day represents the partnerships we have carefully fostered with our fintech clients to drive financial inclusion for millions of people around the globe and provide consumers with greater control and more opportunities to access the quality credit they deserve. “We are actively seeking out unresolved problems and creating products and technologies that will help transform the way businesses operate and consumers thrive in our society. But we know we can’t do it alone,” said Experian North American CEO, Craig Boundy in a recent blog article on Experian’s fintech partnerships. “That’s why over the last year, we have built out an entire team of account executives and other support staff that are fully dedicated to developing and supporting partnerships with leading fintech companies. We’ve made significant strides that will help us pave the way for the next generation of lending while improving the financial health of people around the world.” At Experian, we understand the challenges fintechs face – and our real-world solutions help fintech clients stay ahead of constantly changing market conditions and demands. “Experian’s pace of innovation is very impressive – we are helping both lenders and consumers by delivering technological solutions that make the lending ecosystem more efficient,” said Experian Senior Account Executive Warren Linde. “Financial technology is arguably the most important type of tech out there, it is an honor to be a part of Experian’s fintech team and help to create a better tomorrow.” If you’d like to learn more about Experian’s fintech solutions, visit us at Experian.com/Fintech.

The fact that the last recession started right as smartphones were introduced to the world gives some perspective into how technology has changed over the past decade. Organizations need to leverage the same technological advancements, such as artificial intelligence and machine learning, to improve their collections strategies. These advanced analytics platforms and technologies can be used to gauge customer preferences, as well as automate the collections process. When faced with higher volumes of delinquent loans, some organizations rapidly hire inexperienced staff. With new analytical advancements, organizations can reduce overhead and maintain compliance through the collections process. Additionally, advanced analytics and technology can help manage customers throughout the customer life cycle. Let’s explore further: Why use advanced analytics in collections? Collections strategies demand diverse approaches, which is where analytics-based strategies and collections models come into play. As each customer and situation differs, machine learning techniques and constraint-based optimization can open doors for your organization. By rethinking collections outreach beyond static classifications (such as the stage of account delinquency) and instead prioritizing accounts most likely to respond to each collections treatment, you can create an improved collections experience. How does collections analytics empower your customers? Customer engagement, carefully considered, perhaps comprises the most critical aspect of a collections program—especially given historical perceptions of the collections process. Experian recently analyzed the impact of traditional collections methods and found that three percent of card portfolios closed their accounts after paying their balances in full. And 75 percent of those closures occurred shortly after the account became current. Under traditional methods, a bank may collect outstanding debt but will probably miss out on long-term customer loyalty and future revenue opportunities. Only effective technology, modeling and analytics can move us from a linear collections approach towards a more customer-focused treatment while controlling costs and meeting other business objectives. Advanced analytics and machine learning represent the most important advances in collections. Furthermore, powerful digital innovations such as better criteria for customer segmentation and more effective contact strategies can transform collections operations, while improving performance and raising customer service standards at a lower cost. Empowering consumers in a digital, safe and consumer-centric environment affects the complete collections agenda—beginning with prevention and management of bad debt and extending through internal and external account resolution. When should I get started? It’s never too early to assess and modernize technology within collections—as well as customer engagement strategies—to produce an efficient, innovative game plan. Smarter decisions lead to higher recovery rates, automation and self-service tools reduce costs and a more comprehensive customer view enhances relationships. An investment today can minimize the negative impacts of the delinquency challenges posed by a potential recession. Collections transformation has already begun, with organizations assembling data and developing algorithms to improve their existing collections processes. In advance of the next recession, two options present themselves: to scramble in a reactive manner or approach collections proactively. Which do you choose? Get started

If you’ve seen an uptick in photos of friends and celebrities looking older with wrinkles on your social media feeds, you’re not alone. A new free photo editor has taken the internet by a storm, featuring an AI-powered image-altering application that allows users to see their “future self.” All you have to do is upload a single photo (or few) from your camera roll to be enhanced. While this may seem like harmless fun, the app is now making headlines over increased privacy concerns about what occurs behind the scenes once users submit their selfies. Red flags were raised when multiple alleged negative implications were connected to the app – including the app’s ownership and the potential risk that the app downloaded a user’s entire photo album onto their database. In fact, the privacy concerns also prompted Democratic Party officials to implore federal agencies, including the FBI, “to look into the potential national security and privacy risks the phone app poses to the United States.” Since then, the app’s creators have addressed these concerns, stating most of the photo processing occurs in the cloud and most photos are deleted within 48 hours. Additionally, the only photos uploaded are ones that have been personally submitted by the user. Regardless, a database of user-submitted photos could be seen as a goldmine to fraudsters. In a time where personal and biometric data (including facial recognition) are some of the key ways to validate security, it’s important for consumers to be aware of how and where they’re sharing their data, whether it’s for an age-progression photo app, or their financial accounts. Consumers, businesses, financial institutions – everyone – should exhibit caution and take measures to ensure personal information remains secure and is not being used for nefarious reasons. While consumers may be aware that businesses are collecting data, companies should take steps to form digital trust with transparency. This could be achieved by: Educating consumers on how their data is being used Effectively communicating privacy policies and service terms more concisely Helping consumers feel in control of their information To learn more about research that indicates a shift to advanced authentication methods (including biometrics), fraud trends and how to combat them, download our e-book. Download Now
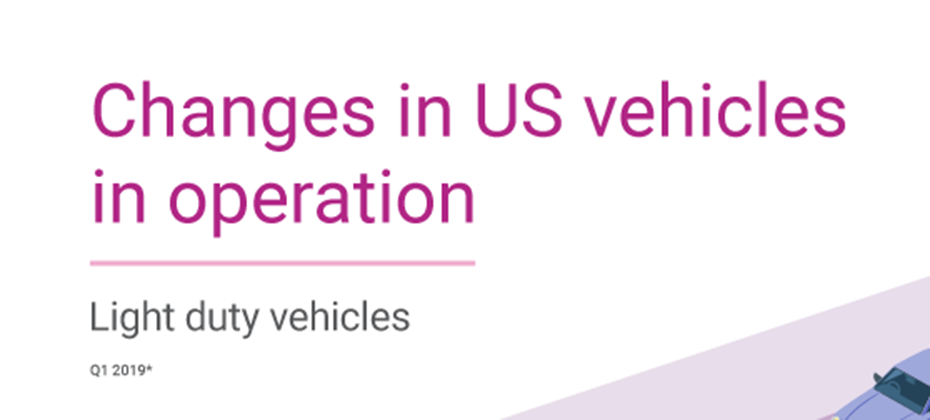
There were 276 million vehicles on the road in Q1 2019.

Once you have kids, your bank accounts will never be the same. From child care to college, American parents spend, on average, over $233,000 raising a child from birth through age 17. While moms and dads are facing the same pile of bills, they often don’t see eye to eye on financial matters. In lieu of Father’s Day, where spending falls $8 million behind Mother’s Day (sorry dads!), we’re breaking down the different spending habits of each parent: Who pays the bills? With 80% of mothers working full time, the days of traditional gender roles are behind us. As both parents share the task of caring for the children, they also both take on the burden of paying household bills. According to Pew Research, when asked to name their kids’ main financial provider, 45% of parents agreed they split the role equally. Many partners are finding it more logical to evenly contribute to shared joint expenses to avoid fighting over finances. However, others feel costs should be divvied up according to how much each partner makes. What do they splurge on? While most parents agree that they rarely spend money on themselves, splurge items between moms and dads differ. When they do indulge, moms often purchase clothes, meals out and beauty treatments. Dads, on the other hand, are more likely to binge on gadgets and entertainment. According to a recent survey on millennial dads, there’s a strong correlation between the domestic tasks they’re taking on and how they’re spending their money. For instance, most dads are involved in buying their children’s books, toys and electronics, as well as footing the bill for their leisure activities. Who are they more likely to spend on? No parent wants to admit favoritism. However, research from the Journal of Consumer Psychology found that you’re more likely to spend money on your daughter if you’re a woman and more likely to spend on your son if you’re a man. The suggested reasoning behind this is that women can more easily identify with their daughters and men with their sons. Overall, parents today are spending more on their children than previous generations as the cost of having children in the U.S. has exponentially grown. How are they spending? When it comes to money management both moms and dads claim to be the “saver” and label the other as the “spender.” However, according to Experian research, there are financial health gaps between men and women, specifically when it pertains to credit. For example, women have 11% less average debt than men, a higher average VantageScore® credit score and the same revolving debt utilization of 30%. Even with more credit cards, women have fewer overall debts and are managing to pay those debts on time. There’s no definite way to say whether moms are spending “better” than dads, or vice versa. Rather, each parent has their own strengths and weaknesses when it comes to allocating money and managing expenses.

Financial institutions preparing for the launch of the Financial Accounting Standard Board’s (FASB) new current expected credit loss model, or CECL, may have concerns when it comes to preparedness, implications and overall impact. Gavin Harding, Experian’s Senior Business Consultant and Jose Tagunicar, Director of Product Management, tackled some of the tough questions posed by the new accounting standard. Check out what they had to say: Q: How can financial institutions begin the CECL transition process? JT: To prepare for the CECL transition process, companies should conduct an operational readiness review, which includes: Analyzing your data for existing gaps. Determining important milestones and preparing for implementation with a detailed roadmap. Running different loss methods to compare results. Once losses are calculated, you’ll want to select the best methodology based on your portfolio. Q: What is required to comply with CECL? GH: Complying with CECL may require financial institutions to gather, store and calculate more data than before. To satisfy CECL requirements, financial institutions will need to focus on end-to-end management, determine estimation approaches that will produce reasonable and supportable forecasts and automate their technology and platforms. Additionally, well-documented CECL estimations will require integrated workflows and incremental governance. Q: What should organizations look for in a partner that assists in measuring expected credit losses under CECL? GH: It’s expected that many financial institutions will use third-party vendors to help them implement CECL. Third-party solutions can help institutions prepare for the organization and operation implications by developing an effective data strategy plan and quantifying the impact of various forecasted conditions. The right third-party partner will deliver an integrated framework that empowers clients to optimize their data, enhance their modeling expertise and ensure policies and procedures supporting model governance are regulatory compliant. Q: What is CECL’s impact on financial institutions? How does the impact for credit unions/smaller lenders differ (if at all)? GH: CECL will have a significant effect on financial institutions’ accounting, modeling and forecasting. It also heavily impacts their allowance for credit losses and financial statements. Financial institutions must educate their investors and shareholders about how CECL-driven disclosure and reporting changes could potentially alter their bottom line. CECL’s requirements entail data that most credit unions and smaller lenders haven’t been actively storing and saving, leaving them with historical data that may not have been recorded or will be inaccessible when it’s needed for a CECL calculation. Q: How can Experian help with CECL compliance? JT: At Experian, we have one simple goal in mind when it comes to CECL compliance: how can we make it easier for our clients? Our Ascend CECL ForecasterTM, in partnership with Oliver Wyman, allows our clients to create CECL forecasts in a fraction of the time it normally takes, using a simple, configurable application that accurately predicts expected losses. The Ascend CECL Forecaster enables you to: Fulfill data requirements: We don’t ask you to gather, prepare or submit any data. The application is comprised of Experian’s extensive historical data, delivered via the Ascend Technology PlatformTM, economic data from Oxford Economics, as well as the auto and home valuation data needed to generate CECL forecasts for each unsecured and secured lending product in your portfolio. Leverage innovative technology: The application uses advanced machine learning models built on 15 years of industry-leading credit data using high-quality Oliver Wyman loan level models. Simplify processes: One of the biggest challenges our clients face is the amount of time and analytical effort it takes to create one CECL forecast, much less several that can be compared for optimal results. With the Ascend CECL Forecaster, creating a forecast is a simple process that can be delivered quickly and accurately. Q: What are immediate next steps? JT: As mentioned, complying with CECL may require you to gather, store and calculate more data than before. Therefore, it’s important that companies act now to better prepare. Immediate next steps include: Establishing your loss forecast methodology: CECL will require a new methodology, making it essential to take advantage of advanced statistical techniques and third-party solutions. Making additional reserves available: It’s imperative to understand how CECL impacts both revenue and profit. According to some estimates, banks will need to increase their reserves by up to 50% to comply with CECL requirements. Preparing your board and investors: Make sure key stakeholders are aware of the potential costs and profit impacts that these changes will have on your bottom line. Speak with an expert

What is CECL? CECL (Current Expected Credit Loss) is a new credit loss model, to be leveraged by financial institutions, that estimates the expected loss over the life of a loan by using historical information, current conditions and reasonable forecasts. According to AccountingToday, CECL is considered one of the most significant accounting changes in decades to affect entities that borrow and lend money. To comply with CECL by the assigned deadline, financial institutions will need to access much more data than they’re currently using to calculate their reserves under the incurred loss model, Allowance for Loan and Lease Losses (ALLL). How does it impact your business? CECL introduces uncertainty into accounting and growth calculations, as it represents a significant change in the way credit losses are currently estimated. The new standard allows financial institutions to calculate allowances in a variety of ways, including discounted cash flow, loss rates, roll-rates and probability of default analyses. “Large banks with historically good loss performance are projecting increased reserve requirements in the billions of dollars,” says Experian Advisory Services Senior Business Consultant, Gavin Harding. Here are a few changes that you should expect: Larger allowances will be required for most products As allowances will increase, pricing of the products will change to reflect higher capital cost Losses modeling will change, impacting both data collection and modeling methodology There will be a lower return on equity, especially in products with a longer life expectancy How can you prepare? “CECL compliance is a journey, rather than a destination,” says Gavin. “The key is to develop a thoughtful, data-driven approach that is tested and refined over time.” Financial institutions who start preparing for CECL now will ultimately set their organizations up for success. Here are a few ways to begin to assess your readiness: Create a roadmap and initiative prioritization plan Calculate the impact of CECL on your bottom line Run altered scenarios based on new lending policy and credit decision rules Understand the impact CECL will have on your profitability Evaluate current portfolios based on CECL methodology Run different loss methods and compare results Additionally, there is required data to capture, including quarterly or monthly loan-level account performance metrics, multiple year data based on loan product type and historical data for the life of the loan. How much time do you have? Like most accounting standards, CECL has different effective dates based on the type of reporting entity. Public business entities that file financial statements with the Security and Exchange Commission will have to comply by 2020, non-public entity banks must comply by 2022 and non-SEC registered companies have until 2023 to adopt the new standard. How can we help: Complying with CECL may require you to gather, store and calculate more data than before. Experian can help you comply with CECL guidelines including data needs, consulting and loan loss calculation. Experian industry experts will help update your current strategies and establish an appropriate timeline to meet compliance dates. Leveraging our best-in-class industry data, we will help you gain CECL compliance quickly and effectively, understand the impacts to your business and use these findings to improve overall profitability. Learn more
Many may think of digital transformation in the financial services industry as something like emailing a PDF of a bank statement instead of printing it and sending via snail mail. After working with data, analytics, software and fraud-prevention experts, I have found that digital transformation is actually much more than PDFs. It can have a bigger and more positive influence on a business’s bottom line – especially when built on a foundation of data. Digital transformation is the new business model. And executives agree. Seventy percent of executives feel the traditional business model will disappear in the next five years due to digital transformation, according to recent Experian research. Our new e-book, Powering digital transformation: Transforming the customer experience with data, analytics and automation, says, “we live in a world of ‘evolve or fail.’ From Kodak to Blockbuster, we’ve seen businesses resist change and falter. The need to evolve is not new. What is new is the speed and depth needed to not only compete, but to survive. Digital startups are revolutionizing industries in months and years instead of decades and centuries.” So how do businesses evolve digitally? First, they must understand that this isn’t a ‘one-and-done’ event. The e-book suggests that the digital transformation life cycle is a never-ending process: Cleanse, standardize and enrich your data to create features or attributes Analyze your data to derive pertinent insights Automate your models and business practices to provide customer-centric experiences Test your techniques to find ways to improve Begin the process again Did you notice the key word or phrase in each of these steps is ‘data’ or ‘powered by data?’ Quality, reliable data is the foundation of digital transformation. In fact, almost half of CEOs surveyed said that lack of data or analytical insight is their biggest challenge to digital transformation. Our digital world needs better access to and insight from data because information derived from data, tempered with wisdom, provides the insight, speed and competitive advantage needed in our hypercompetitive environment. Data is the power behind digital transformation. Learn more about powering your digital transformation in our new e-book>

You’ve Got Mail! Probably a lot of it. Birthday cards from Mom, a graduation announcement from your third cousin’s kid whose name you can’t remember and a postcard from your dentist reminding you you’re overdue for a cleaning. Adding to your pile, are the nearly 850 pieces of unsolicited mail Americans receive annually, according to Reader’s Digest. Many of these are pre-approval offers or invitations to apply for credit cards or personal loans. While many of these offers are getting to the right mailbox, they’re hitting a changing consumer at the wrong time. The digital revolution, along with the proliferation and availability of technology, has empowered consumers. They now not only have access to an abundance of choices but also a litany of new tools and channels, which results in them making faster, sometimes subconscious, decisions. Three Months Too Late The need to consistently stay in front of customers and prospects with the right message at the right time has caused a shortening of campaign cycles across industries. However, for some financial institutions, the customer acquisition process can take up to 120 days! While this timeframe is extreme, customer prospecting can still take around 45-60 days for most financial institutions and includes: Bureau processing: Regularly takes 10-15 days depending on the number of data sources and each time they are requested from a bureau. Data aggregation: Typically takes anywhere from 20-30 days. Targeting and selection: Generally, takes two to five days. Processing and campaign deployment: Usually takes anywhere from three days, if the firm handles it internally, or up to 10 days if an outside company handles the mailing. A Better Way That means for many firms, the data their customer acquisition campaigns are based off is at least 60 days old. Often, they are now dealing with a completely different consumer. With new card originations up 20% year-over-year in 2019 alone, it’s likely they’ve moved on, perhaps to one of your competitors. It’s time financial institutions make the move to a more modern form of prospecting and targeting that leverages the power of cloud technology, machine learning and artificial intelligence to accelerate and improve the marketing process. Financial marketing systems of the future will allow for advanced segmentation and targeting, dynamic campaign design and immediate deployment all based on the freshest data (no more than 24-48 hours old). These systems will allow firms to do ongoing analytics and modeling so their campaign testing and learning results can immediately influence next cycle decisions. Your customers are changing, isn’t it time the way you market to them changes as well?

“We don’t know what we don’t know.” It’s a truth that seems to be on the minds of just about every financial institution these days. The market, not-to-mention the customer base, seems to be evolving more quickly now than ever before. Mergers, acquisitions and partnerships, along with new competitors entering the space, are a daily headline. Customers expect the same seamless user experience and instant gratification they’ve come to expect from companies like Amazon in just about every interaction they have, including with their financial institutions. Broadly, financial institutions have been slow to respond both in the products they offer their customers and prospects, and in how they present those products. Not surprisingly, only 26% of customers feel like their financial institutions understand and appreciate their needs. So, it’s not hard to see why there might be uncertainty as to how a financial institution should respond or what they should do next. But what if you could know what you don’t know about your customer and industry data? Sound too good to be true? It’s not—it’s exactly what Experian’s Ascend Analytical Sandbox was built to do. “At OneMain we’ve used Sandbox for a lot of exploratory analysis and feature development,” said Ryland Ely, a modeler at Experian partner client, OneMain Financial and a Sandbox user. For example, “we’ve used a loan amount model built on Sandbox data to try and flag applications where we might be comfortable with the assigned risk grade but we’re concerned we might be extending too much or too little credit,” he said. The first product built on Experian’s big data platform, Ascend, the Analytical Sandbox is an analytics environment that can have enterprise-wide impact. It provides users instant access to near real-time customer data, actionable analytics and intelligence tools, along with a network of industry and support experts to drive the most value out of their data and analytics. Developed with scalability, flexibility, efficiency and security at top-of-mind, the Sandbox is a hybrid-cloud system that leverages the high availability and security of Amazon Web Services. This eliminates the need, time and infrastructure costs associated with creating an internally hosted environment. Additionally, our web-based interface speeds access to data and tools in your dedicated Sandbox all behind the protection of Experian’s firewall. In addition to being supported by a revolutionized tech stack backed by an $825 million annual investment, Sandbox enables use of industry-leading business intelligence tools like SAS, RStudio, H2O, Python, Hue and Tableau. Where the Ascend Sandbox really shines is in the amount and quality of the data that’s put into it. As the largest, global information services provider, the Sandbox brings the full power of Experian’s 17+ years of full-file historical tradeline data, boasting a data accuracy rate of 99.9%. The Sandbox also allows users the option to incorporate additional data sets including commercial small business data and soon real estate data, among others. Alternative data assets add to the 50 million consumers who use some sort of financial service, in addition to rental and utility payments. In addition to including Experian’s data on the 220+ million credit-active consumers, small business and other data sets, the Sandbox also allows companies to integrate their own customer data into the system. All data is depersonalized and pinned to allow companies to fully leverage the value of Experian’s patented attributes and scores and models. Ascend Sandbox allows companies to mine the data for business intelligence to define strategy and translate those findings into data visualizations to communicate and win buy-in throughout their organization. But here is where customers are really identifying the value in this big data solution, taking those business intelligence insights and being able to take the resulting models and strategies from the Sandbox directly into a production environment. After all, amassing data is worthless unless you’re able to use it. That’s why 15 of the top financial institutions globally are using the Experian Ascend Sandbox for more than just benchmarking and data visualization but also risk modeling, score migration, share of wallet, market entry, cross-sell and much more. Moreover, clients are seeing time-savings, deeper insights and reduced compliance concerns as a result of consolidating their production data and development platform inside Sandbox. “Sandbox is often presented as a tool for visualization or reporting, sort of creating summary statistics of what’s going on in the market. But as a modeler, my perspective is that it has application beyond just those things,” said Ely. To learn more about the Experian Ascend Analytical Sandbox and hear more about how OneMain Financial is getting value out of the Sandbox, watch this on-demand webinar.

Picking up where we left off, online fintech lenders face the same challenges as other financial institutions; however, they continue to push the speed of evolution and are early adopters across the board. Here’s a continuation of my conversation with Gavin Harding, Senior Business Consultant at Experian. (Be sure to read part 1.) Part two of a two-part series: As with many new innovations, fintechs are early adopters of alternative data. How are these firms using alt data and what are the results that are being achieved? In a competitive market, alternative data can be the key to helping fintechs lend deeper and better reach underserved consumers. By augmenting traditional credit data, a lender has access to greater insights on how a thin-file consumer will perform over time, and can then make a credit decision based on the identified risk. This is an important point. While alternative data often helps lenders expand their universe, it can also provide quantitative risk measures that traditional data doesn’t necessarily provide. For example, alternative data can recognize that a consumer who changes residences more than once every two years presents a higher credit risk. Another way fintechs are using alternative data is to screen for fraud. Fraudsters are digitally savvy and are using technology to initiate fraud attacks on a broader array of lenders, in bigger volumes than ever before. If I am a consumer who wants to get a loan through an online fintech lender, the first thing the lender wants to know is that I am who I say I am. The lender will ask me a series of questions and use traditional data to validate. Alternative data takes authentication a step further and allows lenders to not only identify what device I am using to complete the application, but whether the device is connected to my personal account records – giving them greater confidence in validating my identity. A second example of using alternative data to screen for fraud has to do with the way an application is actually completed. Most individuals who complete an online application will do so in a logical, sequential order. Fraudsters fall outside of these norms – and identifying these patterns can help lenders increase fraud detection. Lastly, alternative data can help fintech lenders with servicing and collections by way of utilizing behavioral analytics. If a consumer has a history of making payments on time, a lender may be apt to approve more credit, at better terms. As the consumer begins to pay back the credit advance, the lender can see the internal re-payment history and recommend incremental line increases. From your perspective, what is the future of data and what should fintechs consider as they evolve their products? The most sophisticated, most successful “think tanks” have two things that are evolving rapidly together: Data: Fintechs want all possible data, from a quality source, as close to real-time as possible. The industry has moved from “data sets” to “data lakes” to “data oceans,” and now to “data universes.” Analytics: Fintechs are creating ever-more sophisticated analytics and are incorporating machine learning and artificial intelligence into their strategies. Fintechs will continue to look for data assets that will help them reach the consumer. And to the degree that there is a return on the data investment, they will continue to capitalize on innovative solutions – such as alternative data. In the competitive financial marketplace, insight is everything. Aite Group recently conducted a new report about alternative data that dives into new qualitative research collected by the firm. Join us to hear Aite Group’s findings about fintechs, banks, and credit unions at their webinar on December 4. Register today! Register for the Webinar Click here for more information about Experian’s Alternative Data solutions. Don’t forget to check out part one of this series here. About Gavin Harding With more than 20 years in banking and finance Gavin leverages his expertise to develop sophisticated data and analytical solutions to problem solve and define strategies across the customer lifecycle for banking and fintech clients. For more than half of his career Gavin held senior leadership positions with a large regional bank, gaining experience in commercial and small business strategy, SBA lending, credit and risk management and sales. Gavin has guided organizations through strategic change initiatives and regulatory and supervisory oversight issues. Previously Gavin worked in the business leasing, agricultural and construction equipment sectors in sales and credit management roles.

If your company is like many financial institutions, it’s likely the discussion around big data and financial analytics has been an ongoing conversation. For many financial institutions, data isn’t the problem, but rather what could or should be done with it. Research has shown that only about 30% of financial institutions are successfully leveraging their data to generate actionable insights, and customers are noticing. According to a recent study from Capgemini, 30% of US customers and 26% of UK customers feel like their financial institutions understand their needs. No matter how much data you have, it’s essentially just ones and zeroes if you’re not using it. So how do banks, credit unions, and other financial institutions who capture and consume vast amounts of data use that data to innovate, improve the customer experience and stay competitive? The answer, you could say, is written in the sand. The most forward-thinking financial institutions are turning to analytical environments, also known as a sandbox, to solve the business problem of big data. Like the name suggests, a sandbox is an environment that contains all the materials and tools one might need to create, build, and collaborate around their data. A sandbox gives data-savvy banks, credit unions and FinTechs access to depersonalized credit data from across the country. Using custom dashboards and data visualization tools, they can manipulate the data with predictive models for different micro and macro-level scenarios. The added value of a sandbox is that it becomes a one-stop shop data tool for the entire enterprise. This saves the time normally required in the back and forth of acquiring data for a specific to a project or particular data sets. The best systems utilize the latest open source technology in artificial intelligence and machine learning to deliver intelligence that can inform regional trends, consumer insights and highlight market opportunities. From industry benchmarking to market entry and expansion research and campaign performance to vintage analysis, reject inferencing and much more. An analytical sandbox gives you the data to create actionable analytics and insights across the enterprise right when you need it, not months later. The result is the ability to empower your customers to make financial decisions when, where and how they want. Keeping them happy keeps your financial institution relevant and competitive. Isn’t it time to put your data to work for you? Learn more about how Experian can solve your big data problems. >> Interested to see a live demo of the Ascend Sandbox? Register today for our webinar “Big Data Can Lead to Even Bigger ROI with the Ascend Sandbox.”

Big Data is no longer a new concept. Once thought to be an overhyped buzzword, it now underpins and drives billions in dollars of revenue across nearly every industry. But there are still companies who are not fully leveraging the value of their big data and that’s a big problem. In a recent study, Experian and Forrester surveyed nearly 600 business executives in charge of enterprise risk, analytics, customer data and fraud management. The results were surprising: while 78% of organizations said they have made recent investments in advanced analytics, like the proverbial strategic plan sitting in a binder on a shelf, only 29% felt they were successfully using these investments to combine data sources to gather more insights. Moreover, 40% of respondents said they still rely on instinct and subjectivity when making decisions. While gut feeling and industry experience should be a part of your decision-making process, without data and models to verify or challenge your assumptions, you’re taking a big risk with bigger operations budgets and revenue targets. Meanwhile, customer habits and demands are quickly evolving beyond a fundamental level. The proliferation of mobile and online environments are driving a paradigm shift to omnichannel banking in the financial sector and with it, an expectation for a customized but also digitized customer experience. Financial institutions have to be ready to respond to and anticipate these changes to not only gain new customers but also retain current customers. Moreover, you can bet that your competition is already thinking about how they can respond to this shift and better leverage their data and analytics for increased customer acquisition and engagement, share of wallet and overall reach. According to a recent Accenture study, 79% of enterprise executives agree that companies that fail to embrace big data will lose their competitive position and could face extinction. What are you doing to help solve the business problem around big data and stay competitive in your company?

Trivia question: Millennials don’t purchase new vehicles. True or False?

When it comes to driving the automotive industry forward, Experian Automotive has a motto: “The right cars. The right customers. The right data to know the difference.” We deliver an integrated perspective based on the highest quality automotive information and market intelligence. Data is important to us, and we have the most robust combination of data assets under one roof. The North American Vehicle Database℠, File One℠ Credit Database, Consumer View℠ Marketing Database, Online Activity Databases, and National Fraud Database℠ all fed into Experian’s Auto HyperConnect™. Auto HyperConnect houses two different solutions: Auto HyperTargeting™ and Auto HyperMonitoring™. There are four different components to Auto HyperTargeting, and the one we will focus on today is Expired Lease. Dealers have found success marketing to their own customers when vehicle leases come due. The challenge has been conquesting off-lease consumers who didn’t buy from them. While off-lease consumer marketing lists are available, they only provide the estimated lease end date and monthly lease payment. When restricted to this data, it’s hard to tell if a $550 a month payment is for a Ford F150 or a BMW 3-series. And yet this is exactly the level of detail needed to successfully target off-lease marketing. Experian’s new Auto HyperTargeting- Expired Lease addresses this challenge by enabling dealers to identify and engage off-lease audiences through a highly targeted approach that has never been possible! Now, finding customers is much easier and cost-effective. You can use the best mix of selection criteria to maximize your off-lease conquesting strategy. Some of the ways you can identify your audience are: Lease Maturity Date Vehicle Make Vehicle Model Zip Code Model Performance Tier Distance from Dealer Ship Vehicle Status (New or Used) Signing up for Auto HyperTargeting- Expired Lease comes with five perks. The first is a monthly file. This includes name and address, lease maturity date, make/model, monthly payment bands, and phone and email address when available. The second is the ability to make sign up for a subscription monthly payments. Third is marketing flexibility with direct mail, email, and phone. Four there is no firm offer of credit required for this. Finally, a quarterly sales report. ARA reports provide sales metrics industry wide for your targets. Other competitive features also available in Auto HyperTargeting- Expired Lease is the customers full contact information with name, address, email address and phone number. And for online and offline channels, you can select a specific audience that is customizable. Auto HyperTargeting has some amazing features to successfully conquest customers, and Expired Lease is one of the four ways to do this. Stay tuned for Auto HyperTargeting- Vehicle Owners coming up next!