Tag: CUVs

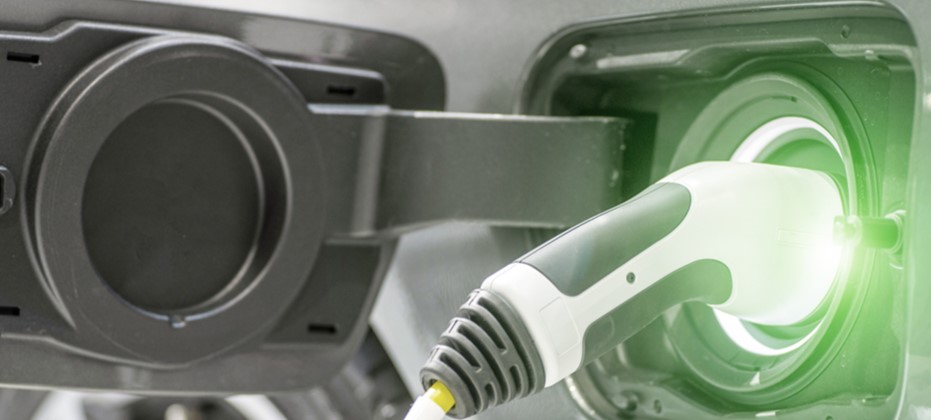
Many across the industry have been waiting to learn how EV activity has changed now that the EV tax credit has been eliminated. According to Experian’s State of the Automotive Finance Market Report: Q3 2025, the EV market saw a sharp uptick in transactions as many locked in these benefits before they disappeared, though it remains to be seen what the market will look like in the fourth quarter. With the EV market expanding and more models entering the lineup, shoppers also benefited from various options across a wider range of price points within their budget. Even so, many opted to lease a new EV rather than purchase it. More than 56% of consumers leased an EV in Q3 2025, up from 46.43% last year. The gap between the number of EV leases and purchases reflects several underlying factors, one of them being this option likely offered lower upfront costs and monthly payments. For instance, the average monthly payment for a lease was $172 lower than a loan for an EV in Q3 2025. Where EV performance stands in the broader market When looking at the data from a larger perspective, EVs made up 25.31% of the total new lease market, compared to 17.69% a year ago. The alternative fuel type also comprised four of the top ten leased models, with Tesla Model Y (4.35%) and Tesla Model 3 (2.58%) as the top two. They were followed by the Honda Prologue (1.78%) as the fifth most leased model and the Hyundai IONIQ 5 (1.49%) as the ninth. EVs making up nearly half of the top ten leased models in the overall market underscores how quickly consumer preferences can shift and how incentives play a role in purchasing behavior. Consumers’ comfort with EV technology continuing to grow paired with the steady expansion of compelling models across segments also highlights the momentum that is being brought to the overall automotive industry. As the market continues to move forward, the interplay of expiring incentives, more model availability, and a strong desire for leasing shows how EVs have steadily become a more prominent consideration. Leveraging these insights will help automotive professionals best position themselves to support consumers navigating an increasingly dynamic landscape. To learn more about EVs and other automotive finance trends, view the full State of the Automotive Finance Market Report: Q3 2025 presentation on demand.

While many view Experian as a credit bureau, we have a rich history in identifying and analyzing emerging market shifts and consumer behaviors across industries, particularly automotive. In fact, Experian’s Automotive Consumer Trends Report: Q1 2025 is one of our many reports that provide essential intel for automotive professionals navigating today’s competitive landscape. And this quarter’s report sheds light on SUVs (including SUVs and CUVs)—a segment that continues to pique consumers’ interest. Data in the first quarter of this year found 62.8% of new retail registrations were SUVs, accounting for the largest portion of market share over the last 12 months—compared to sedans (18.4%), pickup trucks (16.6%), and vans (2.2%). While overall SUV registrations highlight the growing dominance in this sector, a closer look at the data revealed that electric SUVs are emerging as a contributor to this momentum. In Q1 2025, electric SUVs accounted for 10.5% of new retail SUV registrations—and within that group, 30.7% were registered in the state of California. It’s crucial for automotive professionals to monitor these trends and prepare accordingly as the fuel type continues to grow. Which electric SUV models are catching buyers’ attention? Knowing which types of electric SUVs are attracting consumer interest can enable professionals to align their offerings with market demand. The Tesla Model Y made up nearly half of the new retail SUV registrations for exotic and luxury in the last 12 months, coming in at 40.5%. Interestingly, the next closest model, Ford Mustang Mach-E, trailed behind at 5.8%. Rounding out the top five were the Hyundai IONIQ 5 (5.5%), Honda Prologue (4.9%), and Chevrolet Equinox EV (4.3%). Understanding SUV registrations goes beyond data—it’s about spotting the shift in consumer behavior as this segment as well as the EV fuel type continues to break ground in the automotive landscape. This insight gives professionals the leverage they need to adapt and refine their strategies in the next era of mobility. To learn more about SUV insights, view the full Automotive Consumer Trends Report: Q1 2025 presentation.

While CUVs and SUVs continue to dominate the market, sedans remain a popular choice among consumers. According to Experian’s Automotive Consumer Trends Report: Q4 2024, sedans accounted for 18.4% of new retail registrations and 36.9% of used. Comparatively, CUVs/SUVs came in at 59.3% for new and 38.6% for used. For retail sedan registrations, the Toyota Camry made up the most market share for both new and used in the last 12 months, coming in at 10.5% and 6.0%, respectively. Meanwhile, the Honda Civic came in a close second for new sedan registrations at 10.1% and the Honda Accord followed closely for used at 5.9%. Knowing which sedan models are leading in registrations is important for professionals as it helps them understand evolving consumer preferences, enhance marketing strategies, and make informed inventory decisions. Understanding the key generations fueling the sedan segment When examining generational interest in this vehicle segment, data found Gen Z and Millennials over-indexed in new retail sedan registrations. In the past 12 months, Gen Z represented 12.4% of new retail sedan registrations, while their total new retail registration was 8.2%. Millennials had 27.3% of sedan registrations out of 27% total registrations. Understanding who is purchasing and what models they’re gravitating towards can unlock valuable insights as professionals craft their next move and position themselves one step ahead in a competitive market. To learn more about sedan insights, view the full Automotive Consumer Trends Report: Q4 2024 presentation.

With the National Automobile Dealers Association (NADA) Show set to kickoff later this week, it seemed fitting to explore how the shifting dynamics of the used vehicle market might impact dealers and buyers over the coming year. Shedding light on some of the registration and finance trends, as well as purchasing behaviors, can help dealers and manufacturers stay ahead of the curve. And just like that, the Special Report: Automotive Consumer Trends Report was born. As I was sifting through the data, one of the trends that stood out to me was the neck-and-neck race between Millennials and Gen X for supremacy in the used vehicle market. Five years ago, in 2019, Millennials were responsible for 33.3% of used retail registrations, followed by Gen X (29.5%) and Baby Boomers (26.8%). Since then, Baby Boomers have gradually fallen off, and Gen X continues to close the already minuscule gap. Through October 2024, Millennials accounted for 31.6%, while Gen X accounted for 30.4%. But trends can turn on a dime if the last year offers any indication. Over the last rolling 12 months (October 2023-October 2024), Gen X (31.4%) accounted for the majority of used vehicle registrations compared to Millennials (30.9%). Of course, the data is still close, and what 2025 holds is anyone’s guess, but understanding even the smallest changes in market share and consumer purchasing behaviors can help dealers and manufacturers adapt and navigate the road ahead. Although there are similarities between Millennials and Gen X, there are drastic differences, including motivations and preferences. Dealers and manufacturers should engage them on a generational level. What are they buying? Some of the data might not come as a surprise but it’s a good reminder that consumers are in different phases of life, meaning priorities change. Over the last rolling 12 months, Millennials over-indexed on used vans, accounting for more than one-third of registrations. Meanwhile, Gen X over-indexed on used trucks, making up nearly one-third of registrations, and Gen Z over-indexed on cars (accounting for 17.1% of used car registrations compared to 14.6% of overall used vehicle registrations). This isn’t surprising. Many Millennials have young families and may need extra space and functionality, while Gen Xers might prefer the versatility of the pickup truck—the ability to use it for work and personal use. On the other hand, Gen Zers are still early in their careers and gravitate towards the affordability and efficiency of smaller cars. Interestingly, although used electric vehicles only make up a small portion of used retail registrations (less than 1%), Millennials made up nearly 40% over the last rolling 12 months, followed by Gen X (32.2%) and Baby Boomers (15.8%). The market at a bird’s eye view Pulling back a bit on the used vehicle landscape, over the last rolling 12 months, CUVs/SUVs (38.9%) and cars (36.6%) accounted for the majority of used retail registrations. And nearly nine-in-ten used registrations were non-luxury vehicles. What’s more, ICE vehicles made up 88.5% of used retail registrations over the same period, while alternative-fuel vehicles (not including BEVs) made up 10.7% and electric vehicles made up 0.8%. At the finance level, we’re seeing the market shift ever so slightly. Since the beginning of the pandemic, one of the constant narratives in the industry has been the rising cost of owning a vehicle, both new and used. And while the average loan amount for a used non-luxury vehicle has gone up over the past five years, we’re seeing a gradual decline since 2022. In 2019, the average loan amount was $22,636 and spiked $29,983 in 2022. In 2024, the average loan amount reached $28,895. Much of the decline in average loan amounts can be attributed to the resurgence of new vehicle inventory, which has resulted in lower used values. With new leasing climbing over the past several quarters, we may see more late-model used inventory hit the market in the next few years, which will most certainly impact used financing. The used market moving forward Relying on historical data and trends can help dealers and manufacturers prepare and navigate the road ahead. Used vehicles will always fit the need for shoppers looking for their next vehicle; understanding some market trends will help ensure dealers and manufacturers can be at the forefront of helping those shoppers. For more information on the Special Report: Automotive Consumer Trends Report, visit Experian booth #627 at the NADA Show in New Orleans, January 23-26.

The automotive industry is constantly changing. Shifting consumer demands and preferences, as well as dynamic economic factors, make the need for data-driven insights more important than ever. As we head into the National Automobile Dealers Association (NADA) Show this week, we wanted to explore some of the trends in the used vehicle market in our Special Report: State of the Automotive Finance Market Report. Packed with valuable insights and the latest trends, we’ll take a deep dive into the multi-faceted used vehicle market and better understand how consumers are financing used vehicles. 9+ model years grow Although late-model vehicles tend to represent much of the used vehicle finance market, we were surprised by the gradual growth of 9+ model year (MY) vehicles. In 2019, 9+MY vehicles accounted for 26.6% of the used vehicle sales. Since then, we’ve seen year-over-year growth, culminating with 9+MY vehicles making up a little more than 30% of used vehicle sales in 2024. Perhaps more interesting though, is who is financing these vehicles. Five years ago, prime and super prime borrowers represented 42.5% of 9+MY vehicles, however, in 2024, those consumers accounted for nearly 54% of 9+MY originations. Among the more popular 9+MY segments, CUVs and SUVs comprised 36.9% of sales in 2024, up from 35.2% in 2023, while cars went from 44.3% to 42.9% year-over-year and pickup trucks decreased from 15.9% to 15.6%. 2024 highlights by used vehicle age group To get a better sense of the overall used market, the segments were broken down into three age groups—9+MY, 4-8MY, and current +3MY—and to no surprise, the finance attributes vary widely. While we’ve seen the return of new vehicle inventory drive used vehicle values lower, it could be a sign that consumers are continuing to seek out affordable options that fit their lifestyle. In fact, the average loan amount for a 9+MY vehicle was $19,376 in 2024, compared to $24,198 for a vehicle between 4-8 years old and $32,381 for +3MY vehicle. Plus, more than 55% of 9+MY vehicles have monthly payments under $400. That’s not an insignificant number for people shopping with the monthly payment in mind. In 2024, the average monthly payment for a used vehicle that falls under current+3MY was $608. Meanwhile, 4-8MY vehicles came in at an average monthly payment of $498, and 9+MY vehicles had a $431 monthly payment. Taking a deeper dive into average loan amounts based on specific vehicle types—as of 2024, current +3MY cars came in at $28,721, followed by CUVs/SUVs ($31,589) and pickup trucks ($40,618). As for 4-8MY vehicles, cars came in with a loan amount of $22,013, CUVs/SUVs were at $23,133, and pickup trucks at $31,114. Used 9+MY cars had a loan amount of $19,506, CUVs/SUVs came in at $17,350, and pickup trucks at $22,369. With interest rates remaining top of mind for most consumers as we’ve seen them increase in recent years, understanding the growth from 2019-2024 can give a holistic picture of how the market has shifted over time. For instance, the average interest rate for a used current+3MY vehicle was 8.0% in 2019 and grew to 10.2% in 2024, the average rate for a 4-8MY vehicle went from 10.3% to 12.9%, and the average rate for a 9+MY vehicle increased from 11.4% to 13.8% in the same time frame. Looking ahead to the used vehicle market It’s important for automotive professionals to understand and leverage the data of the used market as it can provide valuable insights into trending consumer behavior and pricing patterns. While we don’t exactly know where the market will stand in a few years—adapting strategies based on historical data and anticipating shifts can help professionals better prepare for both challenges and opportunities in the future. As used vehicles remain a staple piece of the automotive industry, making informed decisions and optimizing inventory management will ensure agility as the market continues to shift. For more information, visit us at the Experian booth (#627) during the NADA Show in New Orleans from January 23-26.
As the desire for flexibility and affordability continues to grow across the overall vehicle market, it seems the trend is carrying over into the electric vehicle (EV) space—resulting in more manufacturers rolling out new models as the number of consumers opting for the electric fuel type rises. According to Experian’s Automotive Consumer Trends Report: Q2 2024, non-luxury EV registrations grew to 26.6%, from 22.7% last year, while exotic and luxury declined from 77.3% to 73.4% year-over-year. Furthermore, of the 291.1 million vehicles on the road in Q2 2024, EVs accounted for over 3.5 million, an increase from more than 2.7 million last year. Historically, EVs were often viewed as luxury vehicles that offered limited model availability to choose from. Though, it’s notable that as more non-luxury models are introduced, the EV market share is witnessing a shift in consumer preference. For instance, Ford led the new retail non-luxury EV market at 21.9% in Q2 2024, from 24.0% last year. Hyundai increased from 15.2% to 19.3% year-over-year, Chevrolet decreased from 24.2% to 13.2%, Kia went from 9.2% to 12.5%, and Volkswagen declined to 11.2% this quarter, from 15.8% in Q2 2023. Consumers continue to embrace EVs While understanding the current EV market share allows automotive professionals to assist in-market shoppers more effectively, leveraging multiple data points allows for a more nuanced perspective while helping them prepare for the future as the market continues to evolve. It’s notable that 77.4% of EV owners replaced their current EV with another one in the last 12 months. Meanwhile, 16.2% transitioned to a gasoline fuel type and 3.2% switched to a hybrid. With the EV model lineup expanding, consumers are potentially intrigued by the new options or holding steadfast to a manufacturer. Regardless, the majority of current EV owners are remaining loyal to the fuel type. However, data found that 81% of households with at least one EV also own a gasoline-powered vehicle, 14% also own a hybrid, and 12% own an additional EV. There are a number of factors that can play a role in owning another vehicle alongside an EV—such as range anxiety or tasks that require a larger and more versatile vehicle—so having a secondary option allows consumers to maintain the flexibility to meet diverse transportation needs. To learn more about EV insights, view the full Automotive Consumer Trends Report: Q2 2024 presentation.

According to Experian’s Automotive Market Trends Report: Q1 2024, hybrids accounted for 11.8% of new vehicle registrations, an increase from 8.8% last year.

As more consumers lean towards adaptable and efficient vehicles that fit their everyday lifestyle, it’s no surprise to see the nuanced shifts in consumer preferences over recent years. For instance, compact utility vehicles (CUVs) have resonated with those seeking versatility—emerging as the most registered new vehicle segment in the first quarter of 2024 at 51.1%, according to Experian’s Automotive Consumer Trends Report. When exploring the depths of CUV registrations, data showed Toyota led the market share for the non-luxury segment at 14.9% in Q1 2024. They were followed by Chevrolet (12.1%), Honda (11.4%), Subaru (10.4%), and Hyundai (10.0%). On the luxury side, Tesla accounted for 28.0% of the market share this quarter and Lexus trailed behind at 14.1%. Rounding out the top five were BMW (12.2%), Audi (8.6%), and Volvo (6.2%). CUV registration trends by generations It’s notable that different generations are drawn to CUVs for a multitude of personal preferences that align with their respective lifestyles. For example, Baby Boomers made up 32.3% of new retail registrations for CUVs and Gen X was close behind at 30.4% in Q1 2024. They were followed by Millennials (23.6%), Gen Z (7.9%), and the Silent Generation (5.4%). While some generations seek a vehicle that strikes a balance between practicality and comfort, others may prefer smaller and more maneuverable vehicles. Nonetheless, CUVs making up just over half of new retail registrations is something that should be watched closely. By leveraging multiple data points such as who is in the market for a CUV as well as the types of makes and models they’re interested in, professionals have the opportunity to strategize new ways to effectively reach shoppers. To learn more about CUVs, view the full report at Automotive Consumer Trends Report: Q1 2024. Or

From consumers seeking versatility and additional cargo space to more models becoming available—a discernible trend the automotive industry has seen in recent years is the shift towards utility vehicles such as SUVs and crossover utility vehicles (CUVs). In fact, Experian’s Automotive Market Trends Report: Q4 2023 found that utility vehicles were a significant driver in new vehicle registrations, coming in at 57.3%, up from 56.2% through Q4 2022. Meanwhile, pickup trucks declined from 18.5% last year to 17.2% this quarter and sedans went from 17.1% to 16.5% in the same time frame. Optimizing vehicle maintenance post-manufacturer warranty Despite utility vehicles making up the majority of new vehicle registrations through Q4 2023, passenger vehicles (85.1%) and light trucks (82.7%) had the most vehicles that were outside of the general manufacturer warranty this quarter—mostly due to a high volume of registrations in previous years. By comparison, 67.1% of all utility vehicles were outside the general manufacturer warranty. Understanding the current status of these vehicles enables aftermarket professionals to tailor their service recommendations accordingly. Furthermore, it will be important to monitor this trend over the next few years as the vehicles that are currently under manufacturer warranty will likely need maintenance after it expires. !function(e,n,i,s){var d="InfogramEmbeds";var o=e.getElementsByTagName(n)[0];if(window[d]&&window[d].initialized)window[d].process&&window[d].process();else if(!e.getElementById(i)){var r=e.createElement(n);r.async=1,r.id=i,r.src=s,o.parentNode.insertBefore(r,o)}}(document,"script","infogram-async","https://e.infogram.com/js/dist/embed-loader-min.js"); Vehicle registrations and aftermarket sweet spot When looking at overall registration trends, new vehicles increased 12.5% from last year—reaching 15.3 million through Q4 2023 and used vehicles declined 1.5% year-over-year to 38.2 million this quarter. While monitoring vehicle registration trends helps aftermarket professionals properly assist consumers now and in the future, identifying and understanding the aftermarket “sweet spot” allows them to stay ahead of the curve and adapt to changes as the market continues to evolve. Vehicles in the sweet spot are generally between six- to 12-model-years-old and have aged out of general OEM manufacturer warranties for any repairs. Through Q4 2023, 35.5% of all vehicles in operation landed in the sweet spot, marking a 3.6% year-over-year increase. Though, the aftermarket sweet spot volume is expected to hit its peak in the next few months at nearly 116 million vehicles—considering the record high was 104 million through 2011 and the sweet spot volume reached 102.4 million through Q4 2023. As aftermarket professionals look for ways to reach the right audience, leveraging registration data and the types of vehicles entering the market enables them to adjust their marketing strategies accordingly and plan their services effectively. To learn more about vehicle market trends, view the full Automotive Market Trends Report: Q4 2023 presentation on demand.

According to Experian’s Automotive Consumer Trends Report: Q3 2023, CUVs accounted for 48.3% of new retail registrations and SUVs comprised 13.0%.

As vehicle inventory continues to restore post-pandemic, data through the third quarter of 2023 showed new vehicle registrations are on the rise again—a positive sign that the market is leveling out. According to Experian’s Automotive Market Trends Report: Q3 2023, new vehicle registrations increased 12.7% year-over-year, reaching 11.5 million. On the used side, registrations declined to 29.3 million through Q3 2023, a 2% decrease from 29.9 million last year. Digging a bit deeper, CUVs/SUVs were the most registered new vehicle segment at 56.9%, up from 56.2% compared to last year. Pickup trucks declined from 18.6% to 17.4% year-over-year and sedans went from 17.1% to 16.8% in the same time frame. While knowing what types of vehicles consumers are interested in is beneficial for automotive professionals, breaking down the most sought-after models will paint a fuller picture as they assist shoppers in finding a vehicle that fits their needs. For instance, despite new pickup truck registrations declining year-over-year, the Ford F-150 made up the highest share of new vehicle registrations through Q3 2023—reaching 3%. The Tesla Model Y and Toyota RAV4 were not far behind, both coming in at 2.5% this quarter. They were followed by the Chevrolet Silverado 1500 and Honda CR-V tying at 2.3%. ICE vehicles continue to grow Taking a deeper dive into the fuel type share, ICE vehicles continue to grow year-over-year, even with electric vehicles (EVs) making headway into the market. Experian Automotive’s Vehicles in Operation (VIO) data as of Q3 2023 shows ICE vehicle registrations grew to 265.7 million, up from 264.5 million last year, while hybrid vehicles increased to 8.0 million, from 6.9 million in the same time frame. Meanwhile, EVs went from 2.0 million last year to 3.0 million this year and diesel saw a slight uptick from 9.6 million to 9.9 million in the same period. Leveraging different data points and staying up to date on vehicle registration trends can better prepare professionals as the market remains ever-changing and consumer preference continues to shift. To learn more about vehicle market trends, view the full Automotive Market Trends Report: Q3 2023 presentation on demand.

Experian recently released its Q1 2020 Market Trends report, which provides insights about the vehicles on the road and the most popular vehicle segments.

When it comes to new vehicle registration, there is one segment that stands out from the pack: crossover vehicles. According to Experian’s Q4 2018 Automotive Market Trends Analysis, over the last four years, crossovers (CUVs) have spiked in popularity, representing about a third of new vehicle registrations in 2014 (34.1 percent), but growing to nearly half the new vehicle market in 2018 (47.6 percent). In fact, the large growth in CUVs isn’t limited to just the last four years – there was a large volume of growth year-over-year compared to 2017; the share has grown nearly 4 percent. Sedans and hatchbacks, meanwhile, have seen their share decrease year-over-year. The charts below detail this change in market, based on Experian’s latest 2018 quarterly findings. Source: Experian Automotive VIO as of December 31, 2018 (light duty registered vehicles only) What’s driving this growth? Across the board, the number of light-duty vehicles on the road continues to increase, up to 275.3 million in the U.S. market, at the end of 2018, compared to 271.4 million a year prior. The growth in CUVs isn’t entirely unprecedented, as it’s been going on for a number of years. CUVs continue to grow in popularity for a variety of reasons including: Greater visibility, as the driver sits higher than in a sedan/coupe Larger storage capacities for passengers or cargo Number of varieties available, such as size, engines, and manufactures Higher fuel efficiency than a full-size SUV or minivan Currently, there are over 130 different CUV/SUV Make/Model combos offered, and of those, the different engines, options, etc. drive that volume even higher. Source: Experian Automotive VIO as of December 31, 2018 (light duty registered vehicles only) Potential for growth Currently, there are only two CUVs among the top vehicles in the aftermarket “sweet spot.” Vehicles in the sweet spot are 6 to 12 model years old, and typically aged out of general OEM warranties for any repairs. These vehicles likely require more part replacement services, which may be performed by aftermarket service shops using parts from aftermarket part manufacturers. According to Experian data, the sweet spot has stopped falling and has settled for now. But, there is expected growth of the number of vehicles that fall into the sweet spot over the coming years. One of the segments where the aftermarket industry can begin to focus on will be CUVs. Source: Experian Automotive VIO as of December 31, 2018 (light duty registered vehicles only) The aftermarket can use this data to make more informed product decisions, specifically, around the high volume of CUVs expected to come into the sweet spot. With the number of vehicle options available on the market today, CUVs will continue to stand out as a segment to watch within the auto industry. There’s a greater story beyond the numbers and understanding how to leverage the data at hand can provide the industry with a greater understanding of CUVs and its potential for even greater growth. To learn more about CUVs/SUVs and total vehicles in operation, view the full Q4 2018 Automotive Market Trends Analysis.