
Looking Beyond the Unemployment Rate

by Joseph Mayans 4 min read May 11, 2020

There is no doubt that there will be many headlines published about the latest Bureau of Labor Statistics (BLS) jobs report. The official unemployment rate spiked to 14.7%, the highest level since the Great Depression, and employers shed an unprecedented 20.5 million jobs. However, given the scale and pace that businesses around the country are adjusting their workforces, these headline numbers – especially the official unemployment rate – fall short in capturing the nuances and internal dynamics of the crisis.

To get a better picture of labor market health in the coming months, there are three other components reported in BLS’s employment release that require close attention: the underemployment rate, the labor force participation rate, and the employment-population ratio.

Tracking underemployment
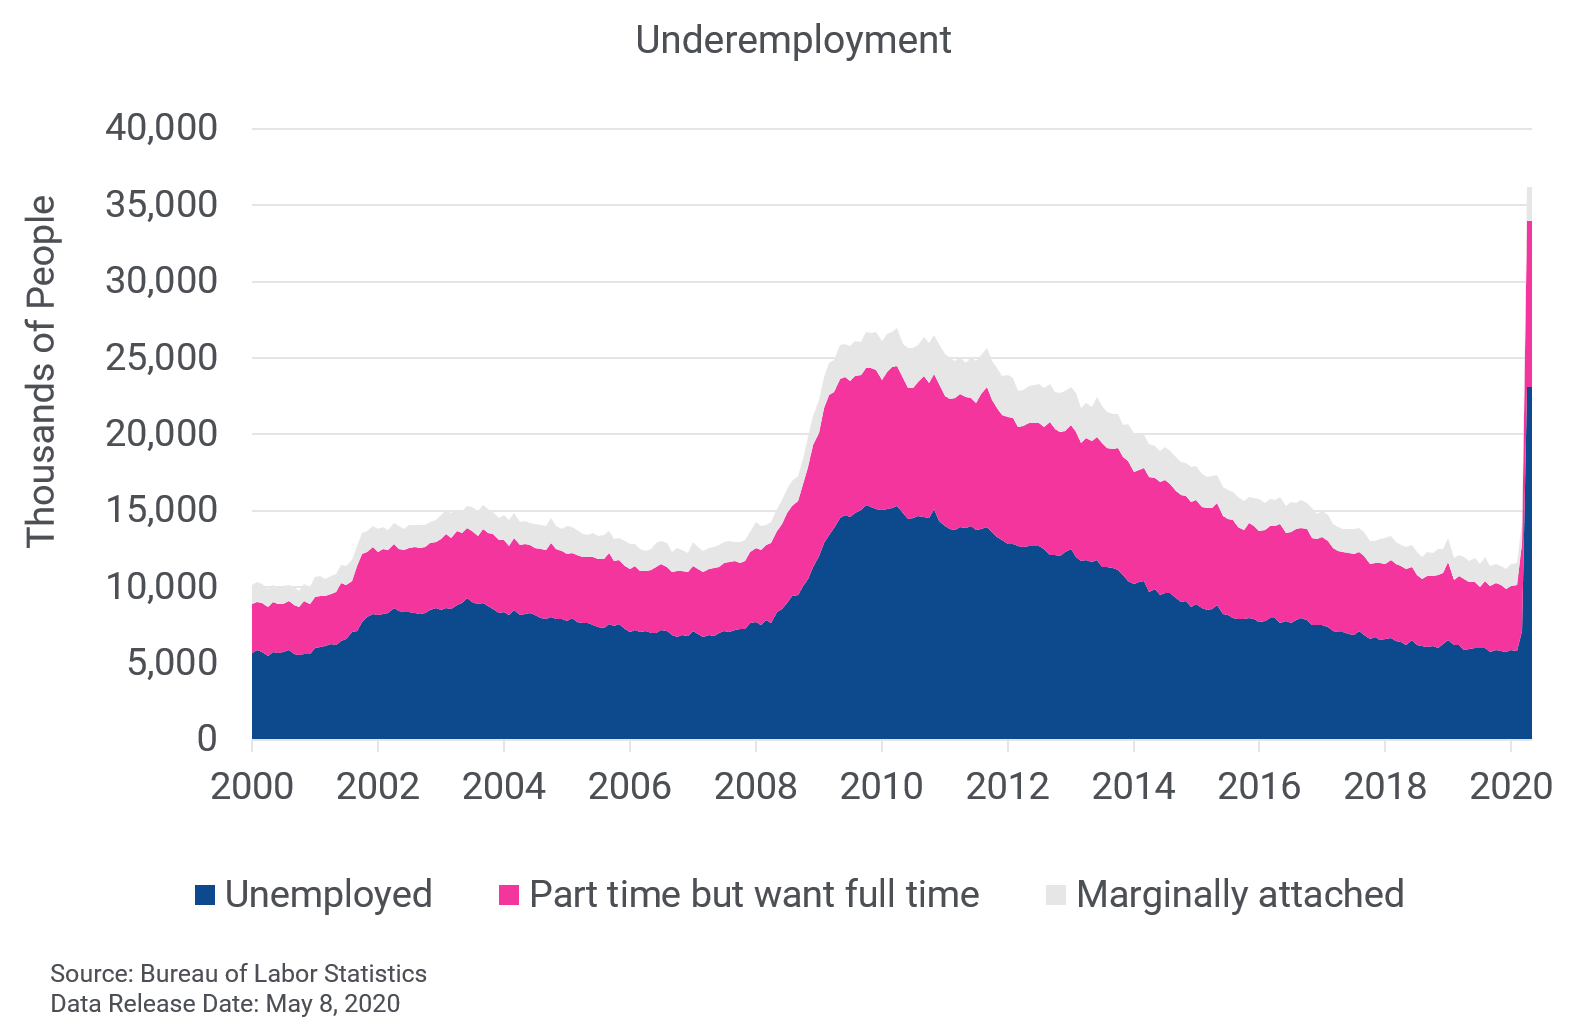
The BLS reports six unemployment figures in its monthly employment release, U1 – U6. The most cited is the “official” unemployment rate, which is U3. However, in the current crisis, the more salient measure of unemployment is U6, which is often known as the “underemployment” rate.

This is because the underemployment (U6) rate takes the unemployed and adds on part-time workers who want a full-time job (BLS calls this segment “part time for economic reasons”), plus marginally attached and discouraged workers (those who don’t think they can find work). Viewing the employment landscape through this lens provides greater insight into the pain points within the labor market.

In April, the underemployment rose from 8.7% to 22.8% – the largest jump on record. A large contributor to the rise was a doubling of the number of part-time workers that wanted a full-time job. Mirroring what happened in previous downturns, the rise in this segment was caused by employers downshifting workers into part-time roles. The official unemployment rate will miss this insight as it classifies everyone who is working as “employed”, regardless if they worked one hour or 100 hours.

Trends in the underemployment rate will be especially important to watch as the recovery gets underway. If employers are doubtful of a strong rebound, they may keep employees on as part time and forgo filling any full-time positions.
Who’s in and who’s out of the labor force

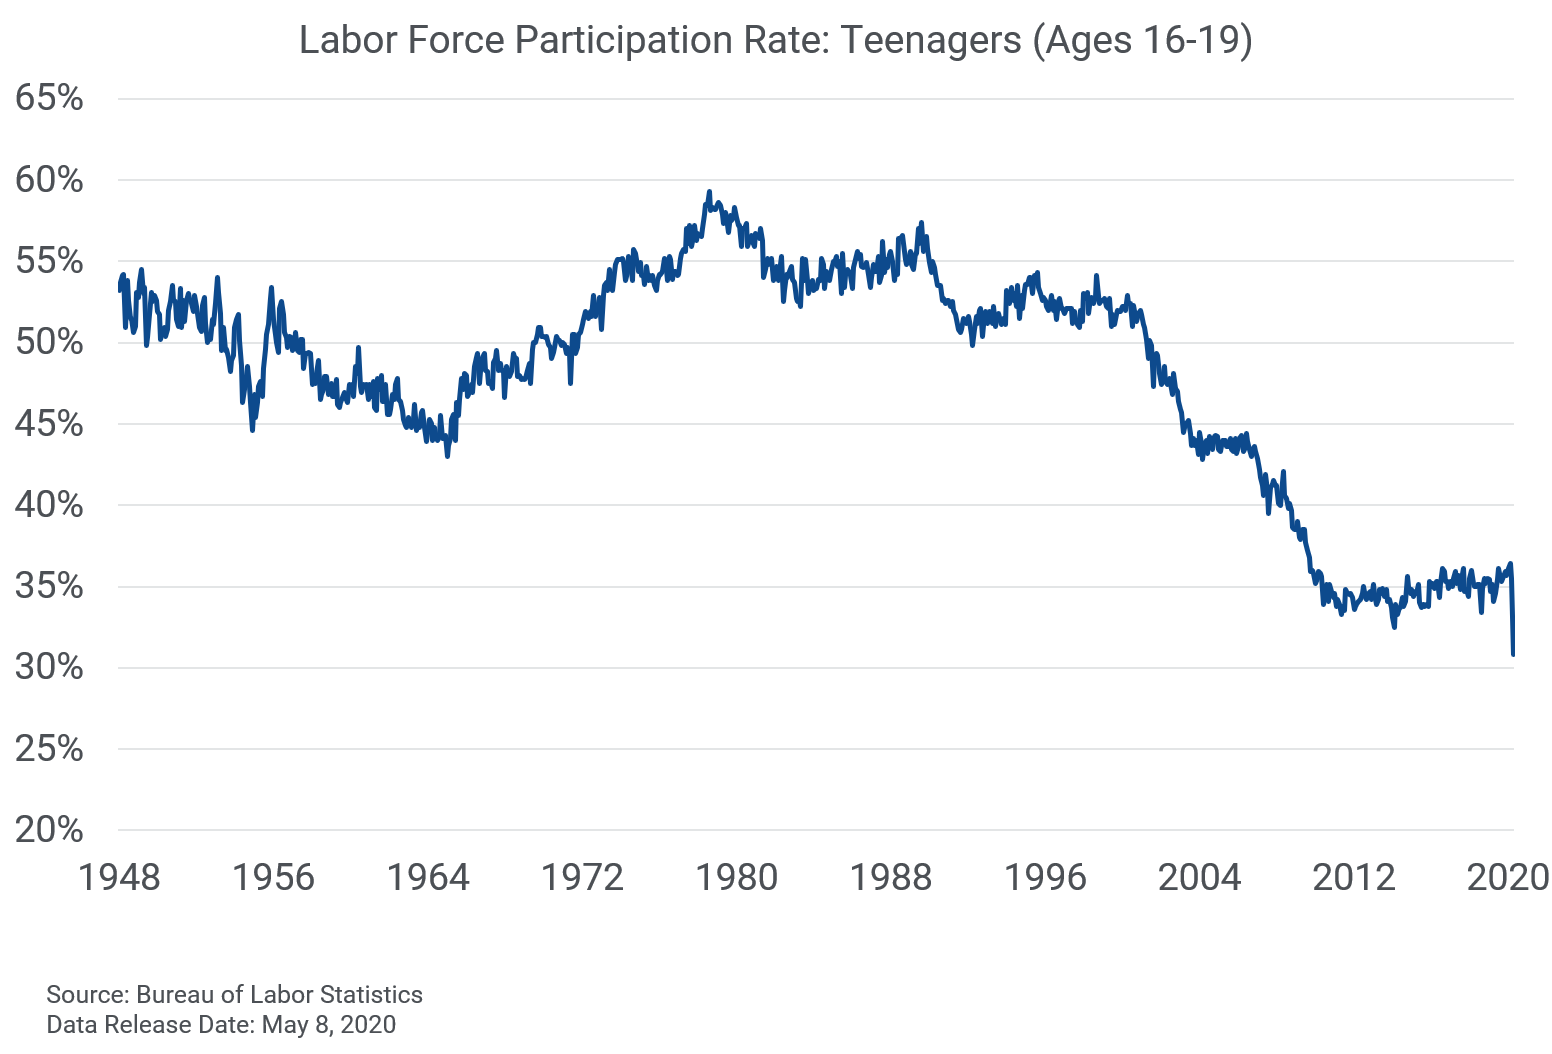
The labor force participation rate is the percentage of the working-age population (aged 16+) that is employed or searching for a job. A decline in the labor force participation rate means that people are leaving the workforce and are no longer looking for employment.

April’s employment report showed labor force participation declining from 62.7% to 60.2%. Teenage participation was especially hard hit, dropping from 35.5% to 30.8% – the lowest level since the government started collecting the data in 1948.

During the recovery phase, tracking what happens with labor force participation will provide insight into how potential workers perceive their chances of landing a job and if it is safe to return. A healthy (or improving) labor market will bring people off the sidelines in search of work, while a weak labor market will do the opposite.

Get a clearer view with the employment-population ratio

In the current environment where people are bouncing rapidly between employed, unemployed, underemployed, and out of the labor force, tracking the employment-population ratio provides a more stable baseline to view the economic environment.
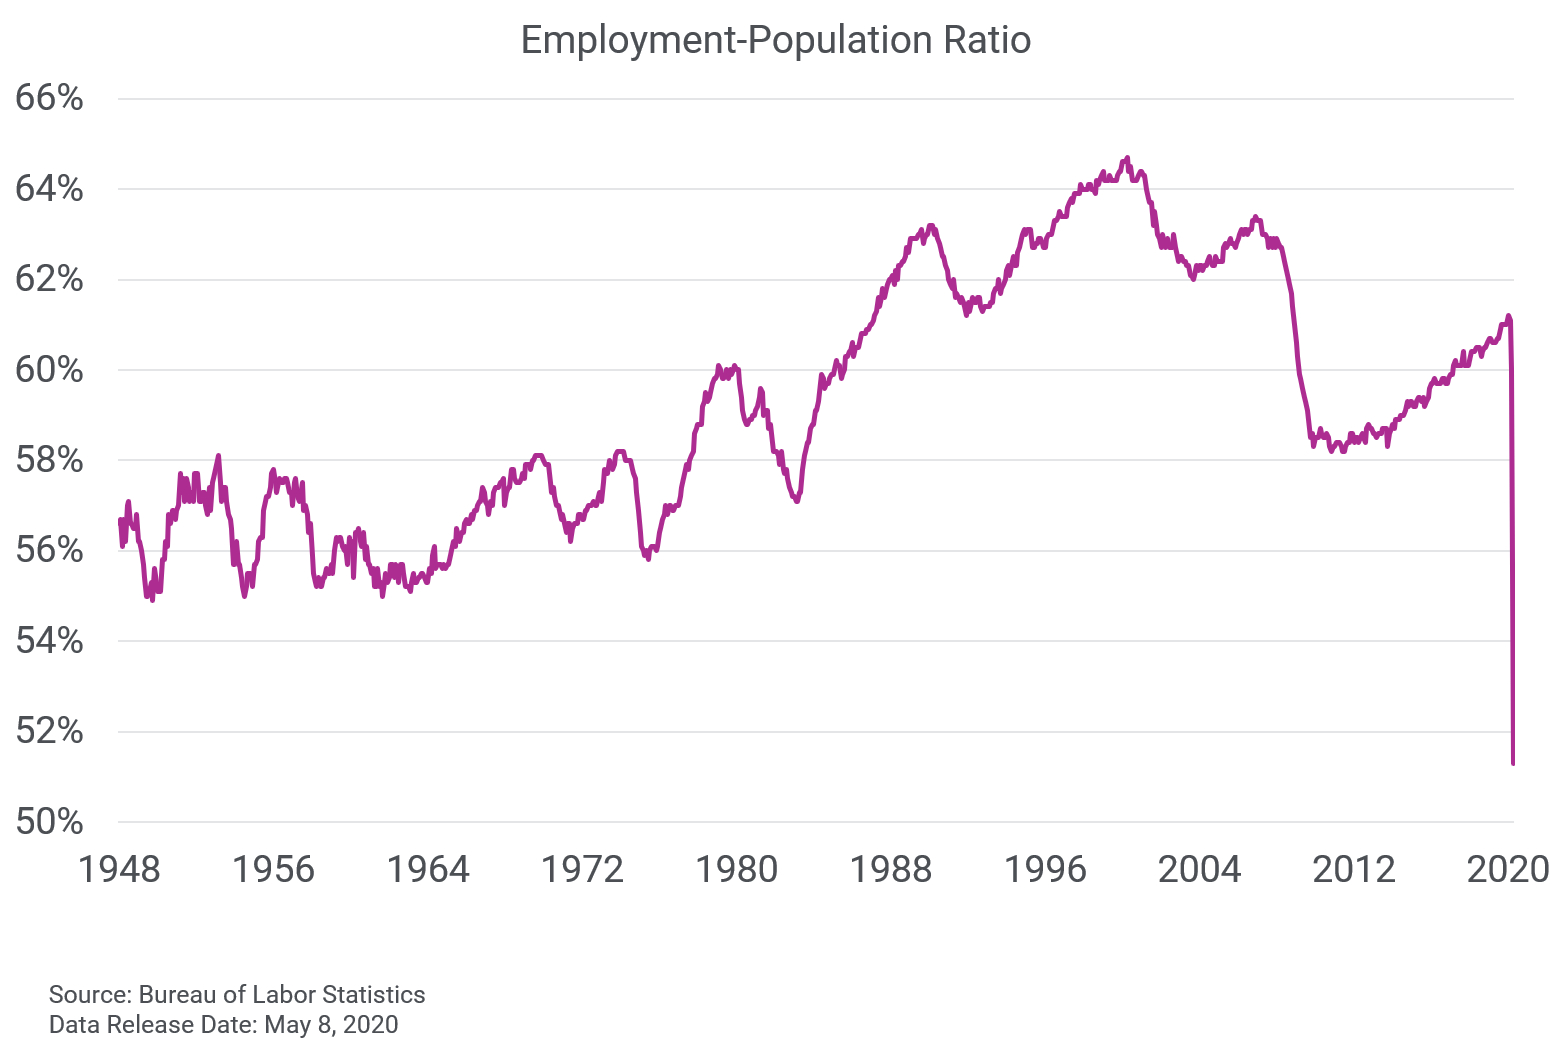
The latest data shows that the employment-population ratio dropped to the lowest level on record of 51.3% in April. This means that only half of people who are of working age in the U.S. are currently employed in some form.

Unlike the unemployment rate, which is calculated by dividing the number of unemployed workers by the labor force and thus subject to more variation as people start and stop looking for work, the employment to population ratio is the percentage of the total working-age population that is currently employed. By having a more stable baseline, it is easier to locate trends and see through the market gyrations.

And finally, why it matters

The labor market is the backbone of the economy and is the engine that powers the US consumer. But the ongoing crisis and rapid reallocation of the workforce has made it difficult to get a clear picture on what is happening at the ground level. By going beyond the headlines, businesses and financial institutions can glean nuanced insights that provide a better view of where the opportunities lie and how the recovery is likely to unfold.

Learn more

Related Posts

The Email Address as Your Most Powerful Identity Signal

The why behind Experian's acquisition of AtData What happens when a comprehensive email intelligence database joins a global leader in data, analytics and fraud prevention? The acquisition of AtData adds 25+ years of building a complete view of email as an identity signal. Financial institutions can recognize, engage and protect customers unlocking a new standard for the way their teams work and the customer experience. That's what Experian's acquisition of AtData delivers. How we got here Not all email addresses tell the same story. Some are newly created. Some exhibit bot-like patterns. Some are inconsistent with every other signal you have about that person. Imagine a real customer. You have a job. You shop online. You have a primary email from your employer, a personal Gmail you've used for 15 years, and an old Yahoo address you still use for shopping because you've been using it since college. You're an engaged customer who interacts with brands, makes purchases and pays bills on time. But each system sees a different version of you. When you apply for credit, the lender sees one email. When you shop, the retailer sees another. When you sign up for a service, you might use the third. For financial institutions: You slow down the approval process to manually verify identity or approve applicants without the full picture. For retailers: You can't tell which version of "customer" is the most engaged, so you either over-mail or under-serve. For fraud systems: Sees a new account created under one email and flags it as suspicious because it doesn't have the history. This was the original problem AtData was built to solve in 1999. Twenty-five years later, that problem didn’t go away, it became more complex. Email fragmentation and device sharing are more common, and identity theft is more sophisticated. Capabilities that now work together Experian has built sophisticated identity and fraud solutions backed by consumer data resources and decades of expertise in credit and risk. AtData brought the ability to assess whether an email address is trustworthy, reachable and consistent—at scale, in real time. Experian is now making email intelligence foundational, not optional. This matters for: Fraud prevention and risk management: Distinguishing a returning customer from a new threat. Knowing whether an email is newly created, exhibiting bot-like patterns or inconsistent with other identities is crucial. Compliance: Building audit trails that can explain identity decisions. Email data history and behavioral signals create the documentation needed to defend your decisions. Credit: Verifying identity in a world where traditional signals are shifting. Email signals provide a persistent, durable identifier that confirms who someone actually is. Marketing: Reaching the right person across email, mail and digital channels. Email intelligence reveals which addresses are actively engaged and reachable. Research shows email remains one of the highest-ROI marketing channels outperforming paid search and social advertising1. The problem every marketer faces: You end up burning budget on addresses that bounce, are unmonitored or are associated with users who never open mail. For credit marketing specifically, email enables faster, more targeted delivery of firm offers across channels, something that's increasingly important in a post-cookie world. "Email is a persistent identifier in a fragmented world. It's what connects a person's postal address, phones, devices, behaviors—the full picture of who they are. By embedding that into our infrastructure, we're not just adding another data point. We're fundamentally improving how businesses understand who their customers are."- Ashley Knight, Senior Vice President, Financial Services and Data Why now? AI is reshaping how decisions are made in every industry. Models are getting faster, more automated and more embedded in core workflows. But AI is only as effective as the data behind it. Fragmented data + fast models = faster, larger-scale misclassifications. In an era of synthetic identities, AI agents, deepfakes and AI-generated activity, the value of durable, persistent, real-world data signals has increased dramatically. Deloitte’s Center for Financial Services projects that generative AI could drive fraud losses in the U.S. up to $40 billion by 2027, a 32% growth rate since 2023. And email sits at the center of it with business email compromise already being one of the most common and costly fraud types. People change phones, move homes and swap devices, but they often hold onto their email for years. That's the signal that protects your business, and the one we've built into the core of how we help you make decisions with confidence. View the press release here

August 6, 2026 by Zohreen Ismail
Building Financial Opportunity Through Purpose-Driven Partnership

Discover how the National Urban League and Experian partner to expand financial literacy and create economic opportunity.

August 6, 2026 by Scarlet Nickel
2026 U.S. Identity and Fraud Report 

Explore key findings and insights from our newly released 2026 U.S. Identity and Fraud Report. Read more now!

August 5, 2026 by Laura Burrows

Subscribe to our Newsletter

Enter your name and email for the latest updates.

This site is protected by reCAPTCHA and the Google Privacy Policy and Terms of Service apply.

Subscribe to our Newsletter

Don't miss out on the latest industry trends and insights!
Subscribe