Loading...

Zoom in on Geographic Data to Inform Strategy

Published: June 10, 2021 by Melinda Zabritski

Woman standing in a car dealership

Data is one of the most powerful tools that lenders and dealers can use to inform their decision making. Looking at trends on a national level is informative, but it can be even more impactful when analyzed at the regional level. When combined, a comprehensive view of data can make all the difference for lenders and dealers when making decisions for their businesses.

New and Used Financing See a Shift in Q1

On a national level, one standout year-over-year change is the breakdown of new and used financing. According to the Q1 2021 State of the Automotive Finance Market report, new vehicles represent a larger portion of the total finance market, increasing from 38.24% in Q1 2020 to 43.20% in 2021. Meanwhile, used financing decreased from 61.76% to 56.80% in the same period.

Loans Remain Most Popular New Vehicle Finance Option

With overall financing on new vehicles increasing across the country, it’s important to dig into what that looks like on a regional level. Across most regions, loans were the preferred method of financing for new vehicles, however, the Northeast saw heavy leasing activity with 46.29% of new vehicles being leased in Q1 2021. Both lenders and dealers can leverage this data to inform expectations and build strategies that address their business on a location-by-location basis.

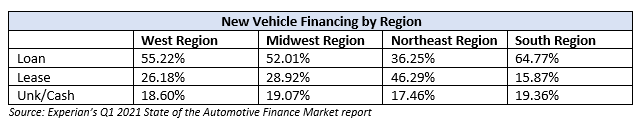
Regional Differences in Types of Vehicles Financed

Similar to the financing options, there were also regional differences when it came to the types of new and used vehicles financed. For instance, the Ford F150 was the top financed new vehicle in the Midwest (3.54%) and South (3.10%), while the Toyota RAV4 took the top spot in the West (3.48%) and the Honda CR-V led in the Northeast (3.55%).

Looking at used vehicles, we saw similar trends in vehicle popularity, with the Ford F150 landing as the top financed vehicle in the West (3.00%), Midwest (4.08%) and South (3.78%) regions, while the Toyota RAV4 lead the Northeast region (2.52%).

Average Credit Scores Increase Year-Over-Year

On a national level, both new and used vehicle credit scores increased compared to last year. The average new credit score across the country increased six points from 728 in 2020 to 734 this year. Looking regionally, the Midwest generally had a higher credit score, while the South had the lowest.

Meanwhile, the average national used credit score saw an increase of eight points, from 655 to 663 in the same time frame. The Midwest region again led with the highest credit scores, and the South with the lowest.

There is an abundance of valuable data lenders and dealers can leverage when strategizing for their businesses. Looking at data on a national level provides an overall view of the auto finance market, but it doesn’t necessarily tell the whole story. Digging into the data on a regional level, however, can help lenders and dealers identify what is working in some areas, what might not be working in others, and how they can adjust their strategies to maximize their goals, wherever they may be located.

Learn more by watching Experian’s full Q1 2021 State of the Automotive Finance Market report.

Related Posts

Amid interest rates leveling out and some lenders reassessing go-to-market strategies, the automotive finance landscape is experiencing notable shifts in market share. According to Experian’s State of the Automotive Finance Market Report: Q1 2025, banks recouped some of their total finance market share for the first time in several years, reaching 26.6% during the quarter, up from 24.8% a year ago. On the other hand, captives’ total market share declined from 31.3% to 29.8% year-over-year and credit unions experienced a modest increase from 20.2% to 20.6%. Despite the overall market share shifts, captives continue to lead in new vehicle financing at 57.1% in Q1 2025, although down from 62.1% the year prior. Meanwhile, banks increased to 24.1% this quarter, from 20.4% in Q1 2024 and credit unions went from 9.6% to 10.9% during the same period. On the used side, banks and credit unions were grouped much closer together. Banks led the way with 28.4% of the used finance market in Q1 2025, up from 27.9% last year, while credit unions went from 27.7% to 28.2% year-over-year and captives declined from 8.5% to 7.4%. As market share movement continues to be a valuable indicator of shifting strategies and consumer behavior, it’s important for automotive professionals to keep a close eye on these shifts to uncover new opportunities while looking for ways to stay ahead of the rapidly evolving industry. Breaking down the latest finance trends Data in the first quarter of 2025 shows the automotive finance market continues to stabilize as automotive professionals gain clearer visibility into lender behavior and consumer demand. For example, the average loan amount for a new vehicle increased $1,110 year-over-year to $41,720 in Q1 2025. However, the average interest rate dropped from 6.9% to 6.7%, and the average monthly payment went from $737 last year to $745 this quarter. For used vehicles, the average loan amount saw a slight uptick of $90 year-over-year, reaching $26,144 this quarter. Meanwhile, the average interest rate declined from 12.4% last year to 11.9% this quarter and the average monthly payment trended lower at $521, from $524 in Q1 2024. Monitoring and leveraging market share shifts and financing trends can support strategic planning while empowering automotive professionals to anticipate consumer purchasing patterns and tailor conversations more effectively to meet buyers where they are during their car buying journey. To learn more about automotive finance trends, view the full State of the Automotive Finance Market: Q1 2025 presentation on demand.

Published: June 5, 2025 by Melinda Zabritski

Quick Summary: Leasing continues to increase in the electric vehicle (EV) market. EVs accounted for nearly 20% of all new vehicle leases in Q4 2024, up from only 2.11% of new vehicle leases four years ago in Q4 2020. With consumers looking for flexibility—both in monthly payment and model availability—we’re seeing leasing continue to surge in the electric vehicle (EV) market. According to Experian’s State of the Automotive Finance Market Report: Q4 2024, EVs accounted for 19.5% of all new vehicle leases this quarter, up from 11.7% last year and a substantial increase from 2.1% in Q4 2020. Diving a bit deeper, data found EVs accounted for 9.3% of all new purchases in Q4 2024. Of those EVs, 50.1% were leased, while 38.9% were financed through loans. With lease payments for EVs ultimately being more affordable compared to loans and the excitement of driving the latest models packed with advanced technology, it’s no surprise we’re seeing leasing grow in popularity. Top leased EVs: How do lease and loan payments compare? As more consumers transition to EVs and manufacturers introduce new options to their lineup, certain models have become top choices for those opting to lease. Tesla accounted for the top two leased EVs in Q4 2024, with Tesla Model 3 coming in at 12.2% and Tesla Model Y at 9.1%. However, the Honda Prologue followed closely at 8.8% this quarter. Rounding out the top five were Hyundai IONIQ 5 (6.9%) and Chevrolet Equinox EV (5.9%). It’s notable that leasing has traditionally been a value-driven option for consumers, and the same holds true in the EV market. Leasing continues to offer lower monthly payments, making the finance option stand out for those looking to test an EV before purchasing or simply wanting the latest model on the lot. In Q4 2024, the average payment difference between a loan and a lease was $175. Though, the average monthly payment to lease a non-luxury EV was $504 this quarter, noting a $205 difference compared to the $709 loan payment. By comparison, the average monthly payment between a loan and leased luxury EV was $98—coming in at $842 for a lease and $940 for a loan. As more consumers choose to lease EVs, automotive professionals in both new and used markets have a chance to capitalize on this trend. By leveraging this data, those in the new retail market can effectively reach the right audience, while those in the used market can stay ahead of the curve and prepare for the influx of off-lease models in the coming years. To learn more about automotive finance trends, view the full State of the Automotive Finance Market: Q4 2024 presentation on demand.

Published: March 6, 2025 by Melinda Zabritski

The automotive industry is constantly changing. Shifting consumer demands and preferences, as well as dynamic economic factors, make the need for data-driven insights more important than ever. As we head into the National Automobile Dealers Association (NADA) Show this week, we wanted to explore some of the trends in the used vehicle market in our Special Report: State of the Automotive Finance Market Report. Packed with valuable insights and the latest trends, we’ll take a deep dive into the multi-faceted used vehicle market and better understand how consumers are financing used vehicles. 9+ model years grow Although late-model vehicles tend to represent much of the used vehicle finance market, we were surprised by the gradual growth of 9+ model year (MY) vehicles. In 2019, 9+MY vehicles accounted for 26.6% of the used vehicle sales. Since then, we’ve seen year-over-year growth, culminating with 9+MY vehicles making up a little more than 30% of used vehicle sales in 2024. Perhaps more interesting though, is who is financing these vehicles. Five years ago, prime and super prime borrowers represented 42.5% of 9+MY vehicles, however, in 2024, those consumers accounted for nearly 54% of 9+MY originations. Among the more popular 9+MY segments, CUVs and SUVs comprised 36.9% of sales in 2024, up from 35.2% in 2023, while cars went from 44.3% to 42.9% year-over-year and pickup trucks decreased from 15.9% to 15.6%. 2024 highlights by used vehicle age group To get a better sense of the overall used market, the segments were broken down into three age groups—9+MY, 4-8MY, and current +3MY—and to no surprise, the finance attributes vary widely. While we’ve seen the return of new vehicle inventory drive used vehicle values lower, it could be a sign that consumers are continuing to seek out affordable options that fit their lifestyle. In fact, the average loan amount for a 9+MY vehicle was $19,376 in 2024, compared to $24,198 for a vehicle between 4-8 years old and $32,381 for +3MY vehicle. Plus, more than 55% of 9+MY vehicles have monthly payments under $400. That’s not an insignificant number for people shopping with the monthly payment in mind. In 2024, the average monthly payment for a used vehicle that falls under current+3MY was $608. Meanwhile, 4-8MY vehicles came in at an average monthly payment of $498, and 9+MY vehicles had a $431 monthly payment. Taking a deeper dive into average loan amounts based on specific vehicle types—as of 2024, current +3MY cars came in at $28,721, followed by CUVs/SUVs ($31,589) and pickup trucks ($40,618). As for 4-8MY vehicles, cars came in with a loan amount of $22,013, CUVs/SUVs were at $23,133, and pickup trucks at $31,114. Used 9+MY cars had a loan amount of $19,506, CUVs/SUVs came in at $17,350, and pickup trucks at $22,369. With interest rates remaining top of mind for most consumers as we’ve seen them increase in recent years, understanding the growth from 2019-2024 can give a holistic picture of how the market has shifted over time. For instance, the average interest rate for a used current+3MY vehicle was 8.0% in 2019 and grew to 10.2% in 2024, the average rate for a 4-8MY vehicle went from 10.3% to 12.9%, and the average rate for a 9+MY vehicle increased from 11.4% to 13.8% in the same time frame. Looking ahead to the used vehicle market It’s important for automotive professionals to understand and leverage the data of the used market as it can provide valuable insights into trending consumer behavior and pricing patterns. While we don’t exactly know where the market will stand in a few years—adapting strategies based on historical data and anticipating shifts can help professionals better prepare for both challenges and opportunities in the future. As used vehicles remain a staple piece of the automotive industry, making informed decisions and optimizing inventory management will ensure agility as the market continues to shift. For more information, visit us at the Experian booth (#627) during the NADA Show in New Orleans from January 23-26.

Published: January 21, 2025 by Melinda Zabritski

Subscribe to our Auto blog

Enter your name and email for the latest updates.

This site is protected by reCAPTCHA and the Google Privacy Policy and Terms of Service apply.