Tag: financing

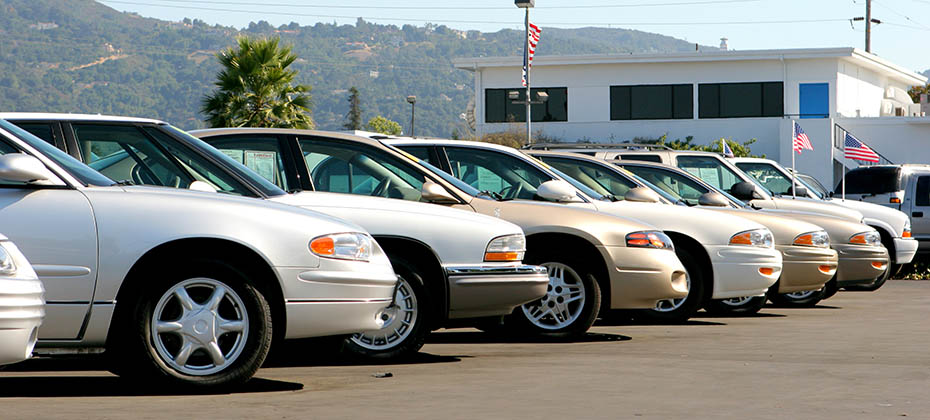
The automotive industry is constantly changing. Shifting consumer demands and preferences, as well as dynamic economic factors, make the need for data-driven insights more important than ever. As we head into the National Automobile Dealers Association (NADA) Show this week, we wanted to explore some of the trends in the used vehicle market in our Special Report: State of the Automotive Finance Market Report. Packed with valuable insights and the latest trends, we’ll take a deep dive into the multi-faceted used vehicle market and better understand how consumers are financing used vehicles. 9+ model years grow Although late-model vehicles tend to represent much of the used vehicle finance market, we were surprised by the gradual growth of 9+ model year (MY) vehicles. In 2019, 9+MY vehicles accounted for 26.6% of the used vehicle sales. Since then, we’ve seen year-over-year growth, culminating with 9+MY vehicles making up a little more than 30% of used vehicle sales in 2024. Perhaps more interesting though, is who is financing these vehicles. Five years ago, prime and super prime borrowers represented 42.5% of 9+MY vehicles, however, in 2024, those consumers accounted for nearly 54% of 9+MY originations. Among the more popular 9+MY segments, CUVs and SUVs comprised 36.9% of sales in 2024, up from 35.2% in 2023, while cars went from 44.3% to 42.9% year-over-year and pickup trucks decreased from 15.9% to 15.6%. 2024 highlights by used vehicle age group To get a better sense of the overall used market, the segments were broken down into three age groups—9+MY, 4-8MY, and current +3MY—and to no surprise, the finance attributes vary widely. While we’ve seen the return of new vehicle inventory drive used vehicle values lower, it could be a sign that consumers are continuing to seek out affordable options that fit their lifestyle. In fact, the average loan amount for a 9+MY vehicle was $19,376 in 2024, compared to $24,198 for a vehicle between 4-8 years old and $32,381 for +3MY vehicle. Plus, more than 55% of 9+MY vehicles have monthly payments under $400. That’s not an insignificant number for people shopping with the monthly payment in mind. In 2024, the average monthly payment for a used vehicle that falls under current+3MY was $608. Meanwhile, 4-8MY vehicles came in at an average monthly payment of $498, and 9+MY vehicles had a $431 monthly payment. Taking a deeper dive into average loan amounts based on specific vehicle types—as of 2024, current +3MY cars came in at $28,721, followed by CUVs/SUVs ($31,589) and pickup trucks ($40,618). As for 4-8MY vehicles, cars came in with a loan amount of $22,013, CUVs/SUVs were at $23,133, and pickup trucks at $31,114. Used 9+MY cars had a loan amount of $19,506, CUVs/SUVs came in at $17,350, and pickup trucks at $22,369. With interest rates remaining top of mind for most consumers as we’ve seen them increase in recent years, understanding the growth from 2019-2024 can give a holistic picture of how the market has shifted over time. For instance, the average interest rate for a used current+3MY vehicle was 8.0% in 2019 and grew to 10.2% in 2024, the average rate for a 4-8MY vehicle went from 10.3% to 12.9%, and the average rate for a 9+MY vehicle increased from 11.4% to 13.8% in the same time frame. Looking ahead to the used vehicle market It’s important for automotive professionals to understand and leverage the data of the used market as it can provide valuable insights into trending consumer behavior and pricing patterns. While we don’t exactly know where the market will stand in a few years—adapting strategies based on historical data and anticipating shifts can help professionals better prepare for both challenges and opportunities in the future. As used vehicles remain a staple piece of the automotive industry, making informed decisions and optimizing inventory management will ensure agility as the market continues to shift. For more information, visit us at the Experian booth (#627) during the NADA Show in New Orleans from January 23-26.

Driven by a range of appealing factors including lower monthly payments and a wider array of models—due to the continuous rise in new vehicle inventory—leasing has reappeared as an optimal choice for consumers who are in the market for a vehicle. According to Experian’s State of the Automotive Finance Market Report: Q2 2024, leasing increased to 25.35%, up from 21.14% in Q2 2023 and 19.30% the year prior. While the average monthly payment and interest rate for a new loan modestly increased year-over-year, leasing is increasingly becoming a more attractive option for those leaning towards flexibility and affordability. For example, the average monthly payment on a leased vehicle was $148 less than a loan this quarter. What’s more, it seems consumers are leaning towards larger vehicles. For instance, the Honda CR-V (2.98%) continued to lead the top leased models in Q2 2024, and it was followed closely by the Tesla Model Y (2.61%). Rounding out the top five were the Honda Civic (2.29%), Ford F-150 (2.02%), and Chevrolet Silverado 1500 (1.86%). Prime financing grows and lease payments decline across all segments When looking at risk distribution trends in Q2 2024, prime consumers accounted for nearly 70% of the total finance market—with prime coming in at 37.82%, down from 39.84% last year and super prime increasing from 28.98% to 31.59% year-over-year. Subprime also saw a slight increase, going from 13% to 13.06% during the same period. It’s notable that all risk segments experienced a decrease in average monthly payments for leased vehicles, as super prime went from $601 in Q2 2023 to $586 in Q2 2024, prime declined to $583 this quarter, from $596 last year, and subprime was at $597, from $611. With the average monthly payments declining year-over-year for majority of shoppers, it can potentially create a more competitive market and drive more consumers towards this finance option—something automotive professionals should keep a close eye on. New and used vehicle finance market overview Data in Q2 2024 found that new vehicle loan amounts increased slightly, reaching $40,927, up from $40,743 last year, and the average interest rate went from 6.78% to 6.84% year-over-year. Despite the increases, the average monthly payment for a new vehicle only experienced a $1 growth to $734 this quarter. On the used side, the average loan amount declined from $27,316 Q2 2023 to $26,248 in Q2 2024, and the average rate grew from 11.47% to 12.01% in the same time frame. Though, the average monthly payment declined to $525 this quarter, from $536 last year. As the automotive industry continues to adapt to the changing market conditions and consumer preferences, it’s important for professionals to leverage the most current data—this will allow them to effectively assist consumers by meeting their financial needs with the available options. To learn more about automotive finance trends, view the full State of the Automotive Finance Market: Q2 2024 presentation on demand.

Experian’s State of the Automotive Finance Market Report: Q4 2022 found that the year-over-year (YOY) average new loan amount increased 4.04%, a smaller growth rate compared to 12.46% YOY in Q4 2021
To help the industry better understand the widespread growth, ahead of the show we compiled an Auto Finance Year-in-Review report to break down all things EV—from financing trends to vehicle segments and more.

According to Experian's State of the Automotive Finance Market Report: Q1 2022, SUVs and CUVs made up 60.38% of total vehicle financing, an increase from 58.95% in Q1 2021.

The automotive finance market is beginning to level out to pre-pandemic trends in Q2 2021.
Trends can vary based on location. In the Q1 2021 State of the Automotive Finance Market report, we took a look at market share nationally and regionally.