When we look at how automotive manufacturers and dealers have marketed vehicles over the last few decades, we can see how through every decade, and every learning, it has led to data-driven marketing strategies that are powering success today. Let’s take a look:
Strategic marketing in the 1990’s
In the 1990’s dealership marketing included mainly newspaper and radio advertisements complimented by occasional direct mail pieces mailing to every home in a zip code. OEMs purchased ad time on popular Television and their dealer associations and local dealers had an option to do the same. Because the 1990’s was the age of “mass media,” marketing was based off geography. There was less attention on channel or audience and a good deal of spending! Cars were sold.
Strategic marketing in the 2000’s
The new millennium brought advancements in computers and databases. Dealerships explored the exciting world of internet promotion and email marketing and continued using traditional newspaper, radio and television to drive traffic. mail programs such as the “scratch and win” or the “key to a car you can win” efforts were common, resulting in massive mail-based marketing campaigns. Then came 2008, when many dealers drastically cut back on spending and were focused mainly on surviving the Great Recession. As we all know, many dealers, and even vehicle makes, did not.
Strategic marketing in the 2010’s
In the beginning of the decade, manufacturers and dealers were still recovering from the recession but were slowly feeling more optimistic about the economy. If there is one thing the industry learned from the recession, it was to be much more strategic when it came to spending. During this decade, ad technology advanced, as did the ability to evaluate marketing spend. Dealers became aware of the true cost of their traditional marketing ways and embarked on new paths of marketing to a smaller but more specific audience. Equity mining and greatly advanced revolutionized the direct mail and related online arena.
As the decade drew to a close, marketers leveraged solutions where merge fields enabled customization and personalization for both direct mail and email marketing. With the ability to deliver massive volumes at a lower cost, email blasts grew in popularity. Social media platforms emerged as a force, and dealers experimented to invent new ways to leverage them. Television marketing underwent a massive facelift as consumers left cable for streaming services resulting in new advertising strategies such as addressable and connected TV, OTT (Over The Top) advertising.
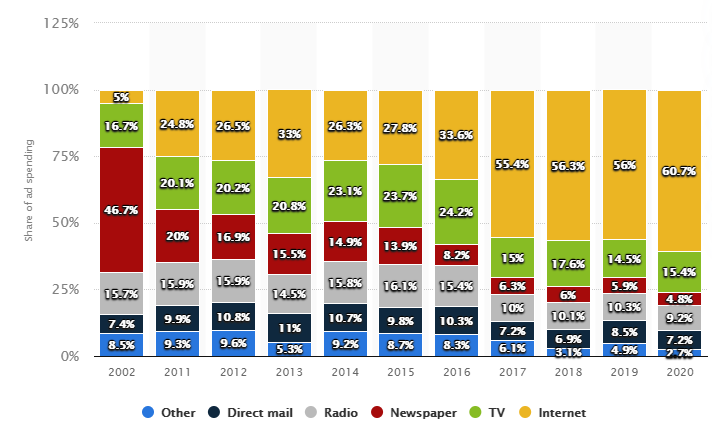
Dealer Ad Spend 2002-2020 by Medium. Statistica 2021.
Strategic marketing in 2020
2020 will forever be remembered as the year of the pandemic. In automotive marketing, it was also the year of reinvention! With many showroom closures, dealers and OEMs found themselves with a reduced advertising budget and a greater need to find more targeted audiences with more effective marketing messaging. How do I master my market share? Who is in-market for my vehicles? How is my website performing? Which customers are in equity? Which customers have added a child to the household? How do I reach them in a digital world? This is where Experian has helped both manufacturers and dealers. Experian’s automotive marketing solutions help marketers utilize vehicle, consumer, lender, and market data to leverage market insights, target the right audience, develop effective messaging strategies, and measure outcomes to continually optimize results.
Over the last four decades, automotive marketing strategies have become much more data driven, so having a solution that uses data insights to help retain loyal customers and win new conquest customers, all while reducing total marketing spend, is a key requirement for success in this decade…and beyond.
If you’re a marketer at a Dealership, learn more about our marketing solutions here.
If you’re an Auto OEM marketer, learn more about our marketing solutions here.