In my last blog, I discussed the basic concept of a maturation curve, as illustrated below:
Exhibit 1
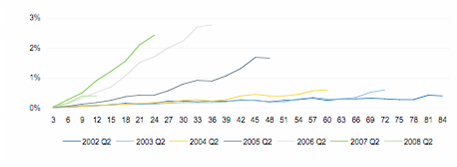
In Exhibit 1, we examine different vintages beginning with those loans originated by year during Q2 2002 through Q2 2008. The purpose of the vintage analysis is to identify those vintages that have a steeper slope towards delinquency, which is also known as delinquency maturation curve.
The X-axis represents a timeline in months, from month of origination. Furthermore, the Y-axis represents the 90+ delinquency rate expressed as a percentage of balances in the portfolio. Those vintage analyses that have a steeper slope have reached a normalized level of delinquency sooner, and could in fact, have a trend line suggesting that they overshoot the expected delinquency rate for the portfolio based upon credit quality standards.
So how can you use a maturation curve as a useful portfolio management tool?
As a consultant, I spend a lot of time with clients trying to understand issues, such as why their charge-offs are higher than plan (budget). I also investigate whether the reason for the excess credit costs are related to collections effectiveness, collections strategy, collections efficiency, credit quality or a poorly conceived budget.
I recall one such engagement, where different functional teams within the client’s organization were pointing fingers at each other because their budget evaporated. One look at their maturation curves and I had the answers I needed. I noticed that two vintages per year had maturation curves that were pointed due north, with a much steeper curve than all other months of the year. Why would only two months or vintages of originations each year be so different than all other vintage analyses in terms of performance?
I went back to my career experiences in banking, where I worked for a large regional bank that ran marketing solicitations several times yearly. Each of these programs was targeted to prospects that, in most instances, were out-of-market, or in other words, outside of the bank’s branch footprint.
Bingo! I got it! The client was soliciting new customers out of his market, and was likely getting adverse selection. While he targeted the “right” customers – those with credit scores and credit attributes within an acceptable range, the best of that targeted group was not interested in accepting their offer, because they did not do business with my client, and would prefer to do business with an in-market player.
Meanwhile, the lower grade prospects were accepting the offers, because it was a better deal than they could get in-market. The result was adverse selection…and what I was staring at was the “smoking gun” I’d been looking for with these two-a-year vintages (vintage analysis) that reached the moon in terms of delinquency.
That’s the value of building a maturation curve analysis – to identify
specific vintages that have characteristics that are more adverse than others. I also use the information to target those adverse populations and track the performance of specific treatment strategies aimed at containing losses on those segments. You might use this to identify which originations vintages of your home equity portfolio are most likely to migrate to higher levels of delinquency; then use credit bureau attributes to identify specific borrowers for an early lifecycle treatment strategy.
As that beer commercial says – “brilliant!”