
Who will take the coveted Super Bowl title in 2016? Now that we’re down to the final two teams, the commentary will heighten. Sportscasters, analysts, former athletes, co-workers … even your local barista has an opinion. Will it be Peyton Manning’s Denver Broncos or the rising Carolina Panthers?
Millions will make predictions in the coming weeks, but a little research can go a long way in delivering meaningful insights.
How have the teams been trending over the season? Are there injuries? Who is favored and what’s the spread? Which quarterback is leading in pass completions, passing yards, touchdowns, etc.? Who has been on this stage before, ready to embrace the spotlight and epic media frenzy?
The world of sports is filled with stats resulting from historical data. And when you think about it, the world of credit could be treated similarly.
Over the past several years, there has been much hype about “credit invisibles” and the need to “score more.” A traditional pull will likely leave many “no-file” and “thin-file” consumers out, so it’s in a lender’s best interest to leverage alternative scoring models to uncover more.
But it’s also important to remember a score is just a snapshot, a mere moment in time. How did a consumer arrive to that particular score pulled on any given day? Has their score been trending up or down? Has an individual been paying off debt at a rapid pace or slipping further behind?
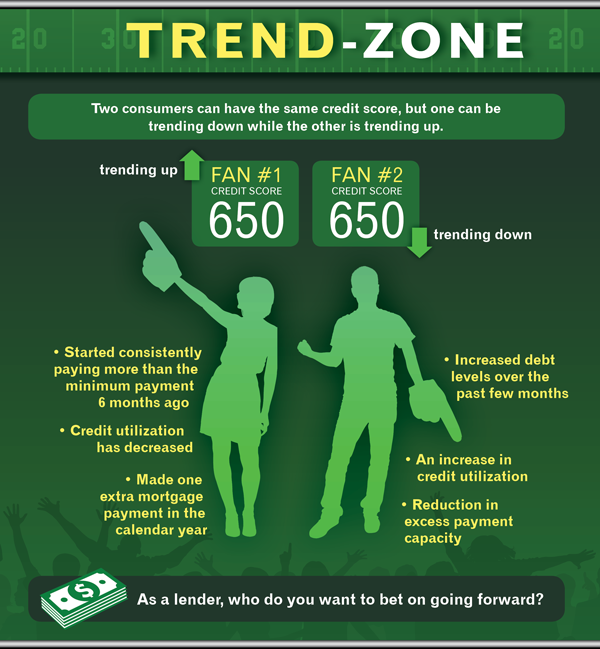
Two individuals could have the exact same score, but likely arrived to that place differently.
The backstory is good to know – in sports and in the world of credit.
Trended data can be attached to balances, credit limits, minimum payment due, actual payment and date of payment.
By assessing these areas on a consumer file for 24 months, more insights are delivered and lenders can take note of behavior patterns to assist with risk assessment, marketing and share-of-wallet analysis.
For example, looking closer at those consumers with five trades or more, Experian trended data reveals:
- 27% are revolvers, carrying balances each month
- 27% are transactors, paying off large portions, or all of their balances
- 9% are rate surfers, who tend to frequently transfer balances to credit cards with 0% or low introductory rates.
Now these consumers can be viewed beyond a score. Suddenly, lenders can look within or outside their portfolio to understand how consumers use credit, what to offer them, and assess overall profitability. In short, trended data provides a more detailed view of a borrower’s historical credit performance, and that richness makes for a more informed decision.
Without a doubt, there is power in the score – and being able to score more – but when it comes time to place your bets, the trended data matters, adding a whole new dimension to an individual’s credit score. Place your wagers accordingly.
As for who will win Super Bowl 2016? I haven’t a clue. I’m more into the commercials. And I hear Coldplay is on for the half-time show. If you’re betting, best of luck, and do your homework.