Despite an unprecedented 18 months since the pandemic was in full force and many Americans were sent home, financial wellness continues to be on the up and up. Consumers continue to manage credit well and the average credit score climbed seven points since 2020 to 695, the highest point in more than 13 years. In Experian’s 12th annual State of Credit report, the headlines are hopeful regarding how Americans are managing personal finances in the face of the pandemic. The report provides a comprehensive look at the credit performance of consumers across America by highlighting consumer credit scores and borrowing behaviors. This year’s report features data from 2019 pre-pandemic, the 2020 pandemic year, and the start of 2021. “The findings from this year’s report show something I’ve always believed: Americans are resilient, for the most part they make smart decisions in the face of adversity and they are agile in adjusting their financial habits when the environment or circumstances change,” said Alex Lintner, President, Experian Consumer Information Services. Highlights of Experian’s State of Credit report: 2021 State of Credit Report 2019 2020 2021 Average VantageScore® credit score [1] 682 688 695 Median VantageScore® credit score 687 697 707 Average number of credit cards 3.0 3.0 3.0 Average credit card balance $6,494 $5,897 $5,525 Average revolving utilization rate 30% 26% 25% Average number of retail credit cards 2.50 2.42 2.33 Average retail credit card balance $1,930 $2,044 $1,887 Average nonmortgage debt $25,057 $25,483 $25,112 Average mortgage debt $210,263 $215,655 $229,242 Average auto loan or lease $19,034 $19,462 $20,505 Average 30–59 days past due delinquency rates 3.8% 2.4% 2.3% Average 60–89 days past due delinquency rates 1.9% 1.3% 1.0% Average 90–180 days past due delinquency rates 6.6% 3.8% 2.5% We asked Joseph Mayans, Principal Economist at Advantage Economics, LLC, for his reactions to the findings: “The State of Credit Report captures the three central themes of the pandemic. First, it shows the overwhelming success of the fiscal support packages. By far, the most striking example of this is the broad based and significant decline in delinquencies during a time when millions of people were out of work. Second, the report showcases the resiliency of American households. People used their stimulus dollars to stay on top of their bills and pay down debt, which boosted average credit scores across all generations. And third, it highlights the unique behavioral shifts brought on by the pandemic. We can see these changes in the rise of housing and auto debt as people bought larger homes and sought to drive rather than ride public transportation.” Generational Trends As indicated in the findings, consumers across all generations except Gen Z saw decreased utilization rates and decreased credit card balances year over year. Consumers are also missing fewer payments with notable improvements seen among the youngest consumers. Mortgage debt was up across every generation, which may correlate with the record low interest rates on mortgages, refinances and moves. According to the CBRE, “the pandemic accelerated several long-standing American migration patterns” as evidenced by more than 15.9 million people filing change-of-address requests with the United States Postal Service. Compared with 2019, 2020 change-of-address requests show a 4% increase in total movers, 2% increase in permanent movers and 27% increase in temporary movers, according to a study by MyMove. Mayans also made note of the mortgage trends. “It’s becoming clearer that millennials are stepping into the homebuying phase in a big way. Once thought to be the generation of apartments and urban revival, many older millennials are now buying homes and moving to the suburbs much like their parents before them,” Mayans said. “This will have significant implications for the post-pandemic world, especially as work from home becomes more prevalent.” State Trends The states with the highest and lowest average credit score remained unchanged from last year with the highest average score of 726 held by Minnesota and an average score of 666 held by Mississippi. New Jersey had the highest number of credit cards and retail cards at 3.37 and 2.54 respectively, and Alaska had the highest credit card debt at $7,089 (U.S. average is $5,525) and Texas had the highest retail debt at $2,248 (U.S. average is $1,888). What Lies Ahead Some have argued that the past year of the pandemic and quarantine forced a lot of time for reflection. The continued positive trends of consumer behavior seem to indicate some of that effort was put toward better financial health practices. That said, like any sourdough bread recipe or DIY home glow-up, there’s always more to learn and opportunities to seize when it comes to financial health. “We are committed to working with lenders and the industry to help consumers gain access to credit, driving broader financial inclusion, while also teaching consumers how to responsibly build and use credit responsibly,” Lintner said. In addition to the free weekly credit report at AnnualCreditReport.com, Experian also offers consumers free access to their credit report and ongoing credit monitoring at Experian.com. Additional credit education resources and tools Join Experian’s #creditchat hosted by @Experian on Twitter with financial experts every Wednesday at 3 p.m. Eastern time. Bilingual and Spanish speakers are also invited to join Experian’s monthly #ChatdeCredito hosted on Twitter at 3 p.m. Eastern time beginning September 16. Visit the Ask Experian blog for answers to common questions, advice and education about credit. Add positive telecom, utility and streaming service payments to your Experian credit report for an opportunity to improve your credit scores by visiting experian.com/boost[2] For additional resources, visit https://www.experian.com/consumereducation To see all the findings, download the 2021 State of Credit Report. Download the full report [1] VantageScore® is a registered trademark of VantageScore Solutions, LLC. VantageScore® credit score range is 300 to 850. [2] Results may vary. See Experian.com for details
In what has been an unprecedented year, marked by a global pandemic and a number of economic and personal challenges for both businesses and consumers, Americans are maintaining healthy credit profiles during the COVID-19 pandemic. Experian released the 11th annual State of Credit report, which provides a comprehensive look at the credit performance of consumers across America by highlighting consumer credit scores and borrowing behaviors. This year’s report provided an extended view into how consumers are managing and repaying their debts; showing most Americans are practicing responsible credit management by reducing utilization rates, credit card balances and late payments. Even in light of the pandemic, data on American consumers across all generations shows responsible credit management including reduced utilization rates, credit card balances and late payments. “While it’s difficult to predict when the economy will return to pre-pandemic levels, we are seeing promising signs of responsible credit management, especially among younger consumers,” said Alex Lintner, group president Experian Consumer Information Services. Highlights of Experian’s State of Credit report: 2020 State of Credit Report 2019 2020 Average VantageScore® credit score [1,2] 682 688 Average number of credit cards 3.07 3.0 Average credit card balance $6,629 $5,897 Average revolving utilization rate 30% 26% Average number of retail credit cards 2.51 2.42 Average retail credit card balance $1,942 $2,044 Average nonmortgage debt [3] $25,386 $25,483 Average mortgage debt $213,599 $215,655 Average 30 - 59 days past due delinquency rates 3.9% 2.4% Average 60 - 89 days past due delinquency rates 1.9% 1.3% Average 90 - 180 days past due delinquency rates 6.8% 3.8% Though not the same, some consumers are experiencing a second economic downturn. The economic fallout stemming from COVID-19 coming after the Great Recession of 2009, which took place in the not too distant past. Silent, Boomer, Gen X and Gen Z Americans are managing responsible credit utilization rates and holding credit cards below the recommended maximum. Are the older generations more credit responsible? Average VantageScore® credit score follows rank order from oldest to youngest – though contributed to by length of time possessing credit, number of lines of credit, and other factors that drive credit score – with the Silent Generation having the highest score (729), then Boomers (716), followed by Gen X (676), Gen Y (658) and Gen Z (654). Gen X consumers have the highest average credit card balance at $7,718 and utilization at 32%, while Gen Z has the lowest average credit card balance at $2,197 and the Silent Generation has the lowest utilization at 13%. Year over year data shows positive results driven by younger borrowers. While average utilization rates dropped for every generation, the most significant decreases were seen in Gen Z borrowers who saw a 6 percent reduction in their use of available credit, followed by Millennials who saw a 5% decrease year-over-year. While Gen Z and Gen Y are carrying more credit cards than they were in 2020, their credit card balances decreased year-over-year. These factors fueled a 13-point increase in average credit scores for Gen Z and an 11-point increase for Millennials. When spliced by state, the data Minnesota had the highest credit score, while Mississippi had the lowest credit score. While the future is still uncertain, perhaps consumers can find comfort in knowing there is much they can do to improve their financial health – including their credit scores – and that there are numerous resources for them to access during these unprecedented times. “As the consumer’s bureau, we are committed to informing, guiding, and protecting consumers. Educating Americans about the factors included in their credit profile and how to manage these responsibly is of critical importance, especially on the road to economic recovery from the COVID-19 pandemic,” said Lintner. In an effort to encourage consumers to regularly monitor and understand the information in their credit reports, Experian joined forces with the other U.S. credit reporting agencies, to offer free weekly credit reports to all Americans through April 2021 via AnnualCreditReport.com. In addition to the free weekly credit report at AnnualCreditReport.com, Experian also offers consumers free access to their credit report and ongoing credit monitoring at Experian.com. Additional credit education resources and tools Experian’s #CreditChat: Hosted by @Experian on Twitter with financial experts every Wednesday at 3 p.m. Eastern time The Ask Experian blog: Find answers to common questions, advice and education about credit Experian Boost: Add positive telecom and utility payments to your Experian credit report for an opportunity to improve your credit scores experian.com/consumer-education-content/ experian.com/coronavirus 1VantageScore® is a registered trademark of VantageScore Solutions, LLC. 2VantageScore® credit score range is 300 to 850.
As consumers prepare for the next decade, we look at how we’re rounding out this year. The results? The average American credit score is 682, an eight-year high. Experian released the 10th annual state of credit report, which provides a comprehensive look at the credit performance of consumers across America by highlighting consumer credit scores and borrowing behaviors. And while the data is spliced to show men vs. women, as well as provides commentary at the state and generational level, the overarching trend is up. Even with the next anticipated economic correction often top of mind for financial institutions, businesses and consumers alike, 2019 was a year marked by more access, more spending and decreasing delinquencies. Things are looking up. “We are seeing a promising trend in terms of how Americans are managing their credit as we head into a new decade with average credit scores increasing two points since 2018 to 682 – the highest we’ve seen since 2011,” said Shannon Lois, Senior Vice President and Head of EAS, Analytics, Consulting & Operations for Experian Decision Analytics. “Average credit card balances and debt are up year over year, yet utilization rates remain consistent at 30 percent, indicating consumers are using credit as a financial tool and managing their debts responsibly.” Highlights of Experian’s State of Credit report: 3-year comparison 2017 2018 2019 Average number of credit cards 3.06 3.04 3.07 Average credit card balances $6,354 $6,506 $6,629 Average number of retail credit cards 2.48 2.59 2.51 Average retail credit card balances $1,841 $1,901 $1,942 Average VantageScore® credit score[1, 2] 675 680 682 Average revolving utilization 30% 30% 30% Average nonmortgage debt[3] $24,706 $25,104 $25,386 Average mortgage debt $201,811 $208,180 $231,599 Average 30 days past due delinquency rates 4.0% 3.9% 3.9% Average 60 days past due delinquency rates 1.9% 1.9% 1.9% Average 90+ days past due delinquency rates 7.3% 6.7% 6.8% In the scope of the credit score battle of the sexes, women have a four-point lead over men with an average credit score of 686 compared to 682. Their lead is a continued trend since 2017 where they’ve bested their male counterparts. According to the report, while men carry more non-mortgage and mortgage debt than women, women have more credit cards and retail cards (albeit they carry lower balances). Generationally, Generations X, Y and Z tend to carry more debt, including mortgage, non-mortgage, credit card and retail card, than older generations with higher delinquency and utilization rates. Segmented by state and gender, Minnesota had the highest credit scores for both men and women, while Mississippi was the state with the lowest average credit score for females and Louisiana was the lowest average credit score state for males. As we round out the decade and head full-force into 2020, we can reflect on the changes in the past year alone that are helping consumers improve their financial health. Just to name a few: Experian launched Experian BoostTM in March, allowing millions of consumers to add positive payment history directly to their credit file for an opportunity to instantly increase their credit score. Since then, there has been over 13 million points boosted across America. Experian LiftTM was launched in November, designed to help credit invisible and thin-file consumers gain access to fair and affordable credit. Long-standing commitments to consumer education, including the Ask Experian Blog and volunteer work by Experian’s Education Ambassadors, continue to offer assistance to the community and help consumers better understand their financial actions. From what we can tell, this is just the beginning. “Understanding the factors that influence their overall credit profile can help consumers improve and maintain their financial health,” said Rod Griffin, Experian’s director of consumer education and awareness. “Credit can be used as a financial tool. Through this report, we hope to provide insights that will help consumers make more informed decisions about credit use as we prepare to head into a new decade.” Learn more 1 VantageScore® is a registered trademark of VantageScore Solutions, LLC. 2 VantageScore® credit score range is 300 to 850. 3 Average debt for this study includes all credit cards, auto loans and personal loans/student loans.
It’s been over 10 years since the first rumblings of Great Recession started in 2008. Today, Americans are experiencing high levels of consumer confidence, marked by high employment rates and increasing credit balances over last year. What have we learned over the last decade? And how do we compare to our behaviors then? Experian released the 9th annual state of credit report, which provides a comprehensive look at the credit performance of consumers across America by highlighting consumer credit scores and borrowing behaviors. Who’s faring the best since the recession? According to the data, younger consumers. “We’re continuing to see the positive effects of economic recovery, especially among younger consumers,” said Michele Raneri, Vice President of Analytics and Business Development at Experian. “Since the recession, responsible credit card behaviors and lower debt among younger consumers is driving an upward trend in average credit scores across the nation. Over the last ten years, those 18 – 21 increased their credit scores by 23 points on average compared to those 18-21 ten years ago.” As a whole, 2018 was a year marked by financial reform, consumer protection and the return of volatility for the financial markets. A large portion of the analytics from this year’s report took a close look at the credit behaviors of today and compared them to 2008, the year the US headed into the worst recession in 80 years. 10-Year Lookback 2008 2017 2018 Average number of credit cards 3.40 3.06 3.04 Average credit card balances $7,101 $6,354 $6,506 Average number of retail credit cards 3.03 2.48 2.59 Average retail credit card balances $1,759 $1,841 $1,901 Average VantageScore® credit score [1,2] 685 675 680 Average revolving utilization 28% 30% 30% Average non-mortgage debt $23,929 $24,706 $25,104 Average mortgage debt $191,357 $201,811 $208,180 Average 30 days past due delinquency rates 5.4% 4.0% 3.9% Average 60 days past due delinquency rates 2.9% 1.9% 1.9% Average 90+ days past due delinquency rates 7.1% 7.3% 6.7% In regards to credit scores, the average VantageScore® credit score increased 5 points from last year, reaching 680 , while still down from 2008. Segmented by state and gender, Minnesota had the highest credit scores for both men and women. Data also showed that women had higher credit scores than men, consistent with 2017 and 2008. The past year has been flooded with headlines illustrating increased spending for American consumers. How do the numbers compare with 2008 data? In comparison with 10 years ago, the number of retail trades since 2008 are down, while average balance is up, according to Experian’s State of Credit Report. Additionally, the number of credit cards is down for all age groups, and balance is also down for consumers 22-71 years of age. Average revolving utilization has creeped up in the past decade, but only two percentage points from 28% to 30%, while both average non-mortgage and mortgage debt has increased 5% and 9% respectively. Not surprisingly, the report reflects that delinquency rates have also increased over 20% since 2008, though down from last year. In conclusion, there’s a lot to learn from both 2008 and 2018. One of the most important and resonating takeaways might be that while fortune may not seem to favor the young, younger consumers are exhibiting responsible behaviors and higher credit scores, setting a precedence for consistent and better financial health in the future. Learn more Experian Boost can help consumers instantly improve their credit score by incorporating their positive payment history from utility and phone bills, among other consumer-permissioned data. [1] VantageScore® is a registered trademark of VantageScore Solutions, LLC. [2] VantageScore® credit score range is 300-850 Calculated on the VantageScore® model. Your VantageScore® credit score from Experian indicates your credit risk level and is not used by all lenders, so don’t be surprised if your lender uses a score that’s different from your VantageScore® credit score.
In 2017, a meaningful jump in consumer sentiment bolstered spending, and caused the spread between disposable personal income and consumer spending to reach an all-time high. This increase in spread was mostly financed through consumer debt, which according to the Federal Reserve Bank of New York has brought total consumer debt to a new peak of $12.8 Trillion surpassing the prior peak in 2008. The Experian eighth annual State of Credit report greatly supported the consumer behavior trends observed for the past year. Spanning the generations It is no surprise that generation Z (the “Great Recession Generation”) is conservative and prudent in their approach to credit because they are the most familiar with the post financial crisis economy. Results showed Millennials experienced a drop in overall debt, and an increase in mortgage debt reflects the national homeownership affordability challenge facing this generation. As first time homebuyers, millennials have to relatively tighten their spending as they dedicate an ever-growing portion of their income to housing. On the other end of the spectrum, the results of the study showed that Baby Boomers’ had sizable debt (including mortgage debt), which reflects the generation’s intent to stay active in their communities and in their homes much longer than prior generations have done. A recent Harvard study reported that by 2035, one out of three American households will be headed by an individual 65 years of age or older, compared to current ratio of one out of five households. What’s on the horizon? It is reasonable to assume that these trends may continue into 2018, as the underlying conditions continue to persist. A closer eye should be kept on student and auto loans due to the significant increase in portfolio size and increasing default rates compare to other debt. Editor’s note: This post was written by Fadel N. Lawandy, Director of the C. Larry Hoag Center for Real Estate and Finance and the Janes Financial Center at the George L. Argyros School of Business and Economics, Chapman University. Fadel joined the George L. Argyors School of Business and Economics, Chapman University after retiring as a Portfolio Manager from Morgan Stanly Smith Barney in 2009. He has two decades of experience in the financial industry with banking, credit management, commercial/residential real estate acquisition and financing, corporate finance, mergers and acquisitions, quantitative and qualitative analysis and research, and portfolio management. Fadel currently serves as the Chairman of the Board and President of CFA Society Orange County, and is an active member of the CFA Institute.
The nation’s economic recovery is continuing in a positive upward trend with consumer credit scores coming exceptionally close to pre-recession numbers—the healthiest in a decade. Experian’s 8th annual State of Credit report reveals the nation’s average credit score is up two points year-over-year to 675, and is just four points shy of the 2007 average of 679. “The trend line we are seeing is quite promising,” said Michele Raneri, Experian vice president of analytics and new business development. “With employment and consumer confidence on the rise, the data is indicating that we have made great progress as a country since the recession. The economy is expected to expand at a healthy pace this year and we believe that credit will continue to rebound. All of the factors point towards a good year for credit in 2018.” The study also revealed that year-over-year: Personal loan and auto loan originations increased 11 percent and 6 percent, respectively. The average number of retail cards remains at 2.5 per consumer, while the average retail debt increased $73 to $1,841 per consumer. The average number of bankcards increased slightly from 3.03 to 3.06, with the average card balance also increasing by $166 to $6,354. Instances of late payments (includes bankcard and retail) remained about the same at under 1 percent. And importantly, consumers have a positive outlook with consumer confidence up 25 percent. Top of the credit charts As part of the annual study, Experian analyzed consumer credit habits in U.S. cities. As in previous years, Minnesota continues to stand out with three of its cities — Minneapolis, Rochester and Mankato—leading the way with credit scores of 709, 708 and 708, respectively. Wausau, Wis. (706), Green Bay, Wis. (705) round out the top five. Again, Greenwood, Miss., and Albany, Ga., ranked the lowest with scores of 624 and 626. While still at the bottom of the list, Greenwood and Abany residents did improve their scores by two points. Riverside, Calif.,—fifth on the list—improved its score by four points—the greatest increase of any city in the bottom 10. Generational divide Taking the research further, Experian analyzed consumer credit information by generation, and found: Generation Z (born 1996 and later) is building credit through different methods than the generations before them, with heavier student loan debts and fewer credit cards and department store cards. And they are keeping debts low and managing them well. Generation Y/Millennials (born 1977-1995) have seen their scores climb four points over the past year. They’ve also decreased their overall average debt by nearly eight percent, but have added six percent in mortgage debt. Generation X (born 1965-1976) has a credit score of 658, the highest mortgage debt of all generations, and a high instance of late payments compared to the national average. Their scores have improved, so they are managing their debts better than in the past,. Baby Boomers (born 1946-1964) continue to carry quite a bit of mortgage debt, and have the lowest late payment instances of all the generations. The Silent Generation (born 1945 and before) has quite a bit of mortgage debt, but are keeping other debts low and making payments on time. At 729, they have the best credit score of all generations and the fewest late payments of any generation. To review findings from Experian’s 2017 State of Credit report, join WiseBread’s chat Jan. 18. To register, go to www.wisebread.com and follow #wbchat. To chat with Experian live, and learn more about credit, join #CreditChat hosted by @Experian_US on Twitter every Wednesday at Noon PT/3 p.m. ET.
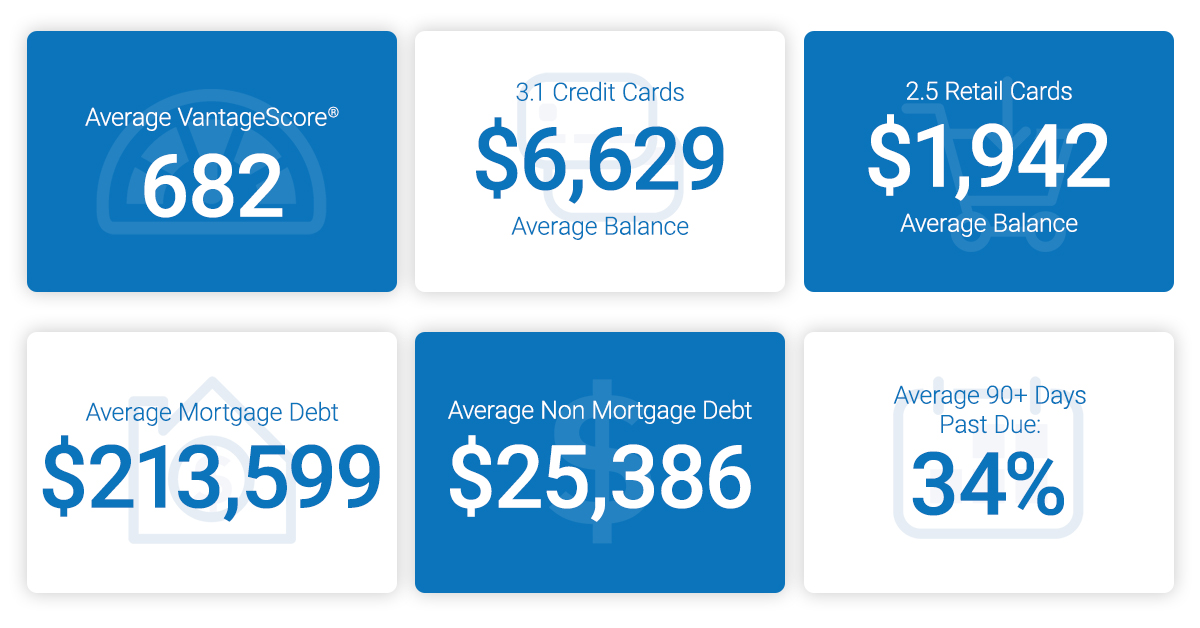
Experian’s latest annual State of Credit analysis provides insight into the differences in credit habits by generation. While the youngest group, Millennials, appear to be novice credit managers, Generation Xers have the highest amount of average debt, are slowest to make payments on time and tied with Millennials for highest percentage of credit utilized. The results of the study reinforce the importance of lenders providing transparent consumer education on credit scores and responsible credit behavior. Snapshot of generational debt differences Baby Boomers (47 to 65) Generation X (30 to 46) Millennials (19 to 29) VantageScore® credit score 700 653 628 Average debt $29,317 $30,039 $23,332 Average balance of bankcards $5,347 $5,343 $2,682 Average revolving utilization 30% 37% 37% Late payments 0.33 0.61 0.58 Download our recent Webinar: It’s a new reality ... and time for a new risk score Source: Experian’s State of Credit infographic