In a previous post, we described how every mortgage borrower’s financial situation and credit profile evolve over time. After a borrower opens a loan, their financial status evolves—jobs are gained and lost; incomes can rise or fall, and financially stressful situations or windfalls can occur. These effects are often reflected in the consumer’s evolving credit score, which changes with the consumer’s payment behavior on open loans, credit inquiry activity, credit card utilization, and other revolving lines, among other things.
Even though MBS, whole loan, and MSR investors ultimately bear borrower credit risk, they may have access to less current borrower credit information than other participants in the mortgage ecosystem.
In securitized markets (both agency MBS and private-label MBS), updated scores are not provided in disclosure to bondholders, even as loans age year over year. In whole loan and MSR markets, a single origination credit score is often provided at the time of bid, and after a successful bid, the investor may have a permissible purpose to pull individual scores on an owned portfolio. But until recently, there was no single loan-level dataset that included continuously refreshed credit scores across the U.S. mortgage market—the type of foundational dataset needed to build and tune credit and prepayment models.
A monthly-refreshed Current Credit Score field meets our three-pronged materiality standard for new data delivery to MBS markets:
New: Provides information not available in existing datasets (i.e., orthogonal to currently available data). Neither private-label MBS nor agency MBS standard market data includes a monthly-refreshed borrower credit score.
Material: Impacts a sizeable portion of the MBS universe. For the vast majority of loans in MBS, borrowers credit scores are available.
Significant: Differentiates collateral performance by a large enough margin to influence trading and risk management decisions. A current credit score wraps all of a borrower’s credit-related behaviors into a single numerical value and has historically been associated with a borrower’s likelihood of becoming 60+ days past due on any obligation within the subsequent 24 months.
In fact, a current credit score is among the most informative indicators of near-term mortgage default risk, as shown in the image below, which depicts 30+ DPD rates by current credit score bands for the entire U.S. mortgage market, controlling for origination score <=650.
Without access to current credit scores, investors are limited to the score at origination—causing the four distinct performance trends shown here to appear as a single averaged line. In reality, score migration since origination reveals significant divergence in credit risk, with the lowest current-score bucket exhibiting a nearly 10 times higher 30+ DPD rate than the highest-score bucket in the latest period shown.
Source: Experian Mortgage Loan Performance (MLP) dataset hosted on IVolatility DataDriven Platform
In this article, we’ll take a quick look at how score migration acts as an early predictor of a performing loan’s first roll into 30-day delinquent status.
MBS Investors’ Current Credit Score Blindspot: Solved
An MBS investor relying on standard market data and securitization remittance reports sees no sign of borrower stress until the subject mortgage loan in the securitization misses a payment and is reported at 30 days delinquent. Of course, in the vast majority of cases, a borrower begins struggling financially well before missing a mortgage payment:
The borrower may miss payments on other types of loans (credit card, auto loan, personal unsecured, or payday loans) as they prioritize their home and mortgage.
Outstanding balances on credit cards may grow as the borrower begins to make only minimum payments on revolvers.
The borrower may apply for additional credit cards, personal or payday loans
The borrower may apply to increase limits on existing credit cards as outstanding balance nears spending limit
All these stress-indicative behaviors result in a decreasing credit score, many months before the borrower misses their first mortgage payment. An MBS investor with access to each borrower’s current credit score, refreshed each month, can predict increased likelihood of default many months before the first missed mortgage payment—and is therefore at a major information advantage relative to the market generally.
Experian’s Mortgage Loan Performance (MLP) dataset contains thousands of fields describing mortgage performance from each borrower, loan, and property perspective, all refreshed monthly (including, amongst other things, new credit scores and refinance inquiry activity, loan performance on all types of debt, filed junior liens, and AVM values).
MLP is much more comprehensive than loan-level data provided by Freddie Mac, Fannie Mae, Ginnie Mae, and PLS data vendors in several ways:
Standard market datasets may not contain certain data elements that some market participants consider useful when evaluating mortgage prepayment or credit performance. Basic, critical fields such as the borrower’s current credit score and the current junior lien balance on the property are missing.
MLP contains borrower, loan, and property data fields spanning a broad portion of the mortgage universe, including Agency, Non-Agency, and Esoteric mortgage products (CES, HELOC, Reverse), including both securitized and non-securitized loans.
MLP enables full three-dimensional (borrower + loan + property) tracking with persistent keys for borrower (before and after refinancing), loan (in securities/deals even after exit due to payoffs or buyouts, including before and after MSR sales), and property. This enables end-to-end analysis of each borrower’s (and property’s) mortgage experience throughout their credit lifecycle.
Is Downward-Trending Credit Score a Signal for Impending Delinquency?
MLP contains thousands of fields describing each loan, borrower, and property across all U.S. mortgages. It allows for virtually unlimited segmentation and granular analysis. For purposes of this illustrative article, we’ll take a high-level look at the entire U.S. mortgage market and perform a quick analysis to confirm intuition that a declining credit score provides a signal for higher likelihood of near-term mortgage delinquency.
Figure 1 illustrates the current pay status (as of 6/30) for the entire U.S. mortgage market, as contained in the MLP dataset, along with count, UPB and UPB-weighted Vantage 4.0 credit score for each bucket.
Figure 1
Source: Experian Mortgage Loan Performance dataset
As illustrated in Figure 1, approximately 772,000 individual mortgage loans were reported to Experian as 30 days delinquent as of 6/30/2026.
Of the 772,000 30d delinquent loans in the June snapshot, approximately 426,000 were current in the prior (May) snapshot. Some of these 426,000 loans were reperformers which had been bouncing from 30 DPD to current over the prior few snapshots. To remove reperformance score noise, we further parsed out the population which: 1) had rolled from current to 30 DPD from May to June; and 2) was consistently current for a full year prior to the 6/30 missed payment. The population meeting both conditions totaled approximately 123,000 loans.
Figure 2 below shows, for this population of 123,000 “clean current” loans, the UPB-weighted average Vantage4 credit score for each of the 12 months leading up to the June missed payment, as well as the impact of the missed payment on the 6/30 score.
Figure 2
Source: Experian Mortgage Loan Performance Dataset
Figure 2 reveals a rather slow and steady ~20-point deterioration of score in the 12 months prior to first missed payment – as well as the 80-point drop once the missed payment hits. When we compare this cohort’s Vantage 4.0 score trend to the broader Current population across the entire dataset in Figure 3, we see a marked difference in both absolute value and trend:
Figure 3
Source: Experian Mortgage Loan Performance Dataset
Not only is the cohort’s starting Vantage 4.0 score lower than the broader current population, but it also displays a dropping trend (with a notable 2 to 3x acceleration in monthly score drop the month before the first missed mortgage payment) while the broader Current population’s score (of which the isolated cohort is a subset) remains rock steady.
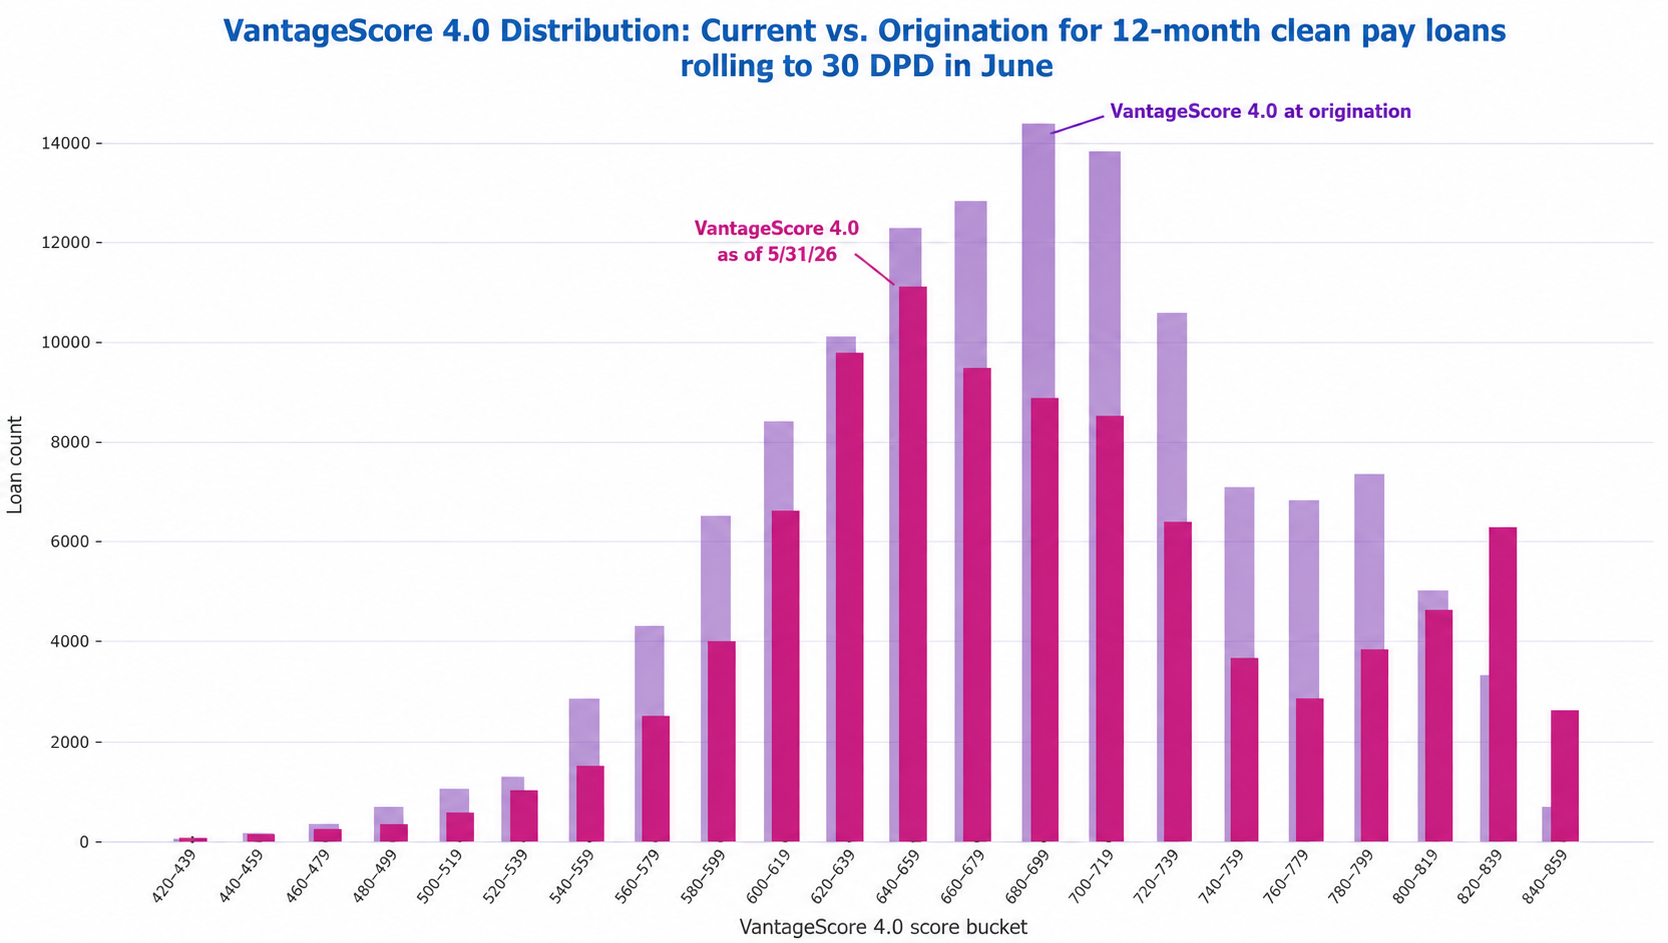
Lastly, we present Figure 4, a histogram comparing the distribution of at-origination and as-of 5/30 (i.e., the period just before the missed June mortgage payment) credit scores for the clean current population. The distribution appears to shift toward lower credit scores. To the extent credit scores are correlated with credit risk, this shift may indicate elevated credit risk relative to origination. Since this degradation occurs during a period of perfect mortgage pay performance, it is invisible to MBS investors who lack access to current borrower credit scores. Experian MLP provides monthly refreshed credit scores for mortgage borrowers contained within the MLP database.
Figure 4
Source: Experian Mortgage Loan Performance Dataset