Since the advent of the internet, our lives have changed drastically for the better. We can perform many of life’s daily activities from the comfort of our own home. According to Aite, in 2016 alone 36 million Americans made some form of mobile payment — paying a bill, purchasing something online, paying for fast food or making a mobile wallet purchase at a retailer. Simply put, the internet has made our lives easier. But with the good also comes the bad. While most consumers have moved to the digital world, so have fraudsters. With minimal risk and high reward at stake, e-commerce fraud attacks have increased dramatically over the last few years, with no signs of slowing down.
We recently analyzed millions of transactions from the first half of 2017 to identify fraud attack rates based on billing and shipping addresses and broke down the findings into various geographic trends. Fraud attack rates represent the attempted fraudulent e-commerce transactions against the population of overall e-commerce orders.
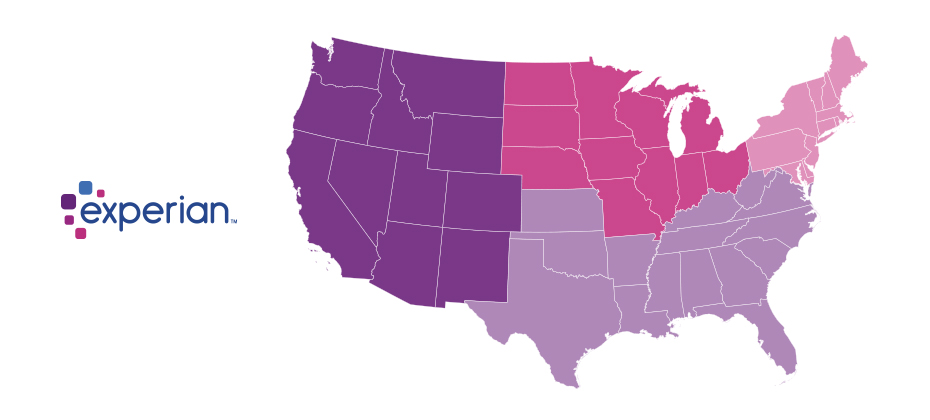
Consumers living out West and in the South have experienced more than their fair share of fraud. During the first half of 2017, the West and the South were the top two regions for both billing and shipping attacks. While both regions were at the top during the same time last year, the attacks themselves have increased substantially. Given the proximity to seaports and major international airports, this is somewhat unsurprising — particularly for shipping fraud — as many fraudsters will leverage reshippers to transport goods soon after delivery.
.dataTb{margin:20px auto;width:100%}.dataTb:after{clear:both}.dataTb table{}.dataTb td,.dataTb th{border:1px solid #ddd;padding:.8em}.dataTb th{background:#F4F4F4}.tbL{float:left;width:49%}.tbR{float:right;width:49%;margin:0 0 0 2%}
| Shipping: Riskiest Regions | |
|---|---|
| Region | Attack rate |
| West | 38.1 |
| South | 32.1 |
| Northeast | 27.0 |
| North Central | 20.7 |
| Billing: Riskiest Regions | |
|---|---|
| Region | Attack rate |
| West | 37.2 |
| South | 32.9 |
| Northeast | 27.3 |
| North Central | 24.0 |
At the state level, the top three shipping fraud states remained the same as 2016 — Delaware, Oregon and Florida — but the order changed. Oregon was the most targeted, with a fraud rate of 135.2 basis points, more than triple its rate at in the end of 2016.
Though no longer in the top spot, Delaware saw alarming spikes as well, with shipping attack rates nearly triple last year’s rate at 128.6 basis points and billing attacks at 79.6 basis points.
.dataTb{margin:20px auto;width:100%}.dataTb:after{clear:both}.dataTb table{}.dataTb td,.dataTb th{border:1px solid #ddd;padding:.8em}.dataTb th{background:#F4F4F4}.tbL{float:left;width:49%}.tbR{float:right;width:49%;margin:0 0 0 2%}
| Shipping: Riskiest States | |
|---|---|
| State | Attack rate |
| Oregon | 135.2 |
| Delaware | 128.2 |
| Florida | 57.4 |
| New York | 45.0 |
| Nevada | 36.9 |
| California | 36.9 |
| Georgia | 33.5 |
| Washington, D.C | 30.8 |
| Texas | 29.6 |
| Illinois | 29.4 |
| Billing: Riskiest States | |
|---|---|
| Region | Attack rate |
| Oregon | 87.5 |
| Delaware | 79.6 |
| Washington, D.C. | 63.0 |
| Florida | 47.4 |
| Nevada | 38.8 |
| California | 36.9 |
| Arkansas | 36.6 |
| New York | 35.5 |
| Vermont | 34.2 |
| Georgia | 33.4 |
Diving a bit deeper, ZIPTM codes in Miami, Fla., make up a significant portion of the top 10 ZIP CodeTM lists for shipping and billing attacks — in fact, many of the same ZIP codes appear on both lists. The other ZIP Code that appears on both lists is South El Monte, Calif., which has a high percentage of industrial properties — common targets for fraudsters to ship packages, then reship overseas. You can download the top 100 riskiest Zip Codes in the U.S. for H1 2017.
.dataTb{margin:20px auto;width:100%}.dataTb:after{clear:both}.dataTb table{}.dataTb td,.dataTb th{border:1px solid #ddd;padding:.8em}.dataTb th{background:#F4F4F4}.tbL{float:left;width:49%}.tbR{float:right;width:49%;margin:0 0 0 2%}
| Shipping: Top 10 riskiest ZIP™ Codes | |
|---|---|
| ZIP Code | Attack rate |
| 33122 [Miami, Fla.] | 2409.4 |
| 91733 [South El Monte, Calif.] | 1655.5 |
| 33198 [Miami, Fla.] | 1295.2 |
| 33166 [Miami, Fla.] | 1266.0 |
| 33195 [Miami, Fla.] | 1037.3 |
| 33192 [Miami, Fla.] | 893.9 |
| 97251 [Portland, Ore.] | 890.6 |
| 07064 [Port Reading, NJ] | 808.9 |
| 89423 [Minden, Nev.] | 685.5 |
| 77072 [Houston, Tex.] | 629.3 |
| Billing: Top 10 riskiest ZIP™ Codes | |
|---|---|
| ZIP Code | Attack rate |
| 77060 [Houston, Tex.] | 1337.6 |
| 33198 [Miami, Fla.] | 1215.6 |
| 33122 [Miami, Fla.] | 1106.2 |
| 33166 [Miami, Fla.] | 1037.4 |
| 91733 [South El Monte, Calif.] | 780.1 |
| 33195 [Miami, Fla.] | 713.7 |
| 97252 [Portland, Ore.] | 670.8 |
| 33191 [Miami, Fla.] | 598.8 |
| 33708 [St. Petersburg, Fla.] | 563.6 |
| 33792 [Miami, Fla.] | 493.0 |
As e-commerce fraud continues to grow, businesses need to be proactive to keep themselves and their customers safe. That means incorporating multiple, layered fraud prevention strategies that work together seamlessly — for example, understanding details about users and their devices, knowing how users interact with the business and evaluating previous transaction history. This level of insight can help businesses distinguish real customers from nefarious ones without impacting the customer experience.
While businesses are ultimately responsible for the safety of customers and their data, the onus doesn’t rest solely with them. Consumers should also be vigilant when it comes to protecting their digital identities and payment information. That means creating strong, unique passwords; actively monitoring online accounts; and using two-factor authentication to secure account access.
At the end of the day, e-commerce fraud is a challenge that businesses and consumers will experience for the foreseeable future. But rising attack rates don’t have to spell doom and gloom for the industry. E-commerce growth is still extremely strong, as consumers interact through multiple channels (in-store, mobile and web) and expect a personalized experience. Establishing trust and verifying digital identities are key to meeting these latest expectations, which provide new opportunities for businesses and consumers to interact seamlessly and transact securely. With multiple safeguards in place, businesses have a variety of options to protect their customers and their brand reputation.