Loading...

New California Mandate Rekindles Electric Vehicle Buzz

Published: November 9, 2020 by Guest Contributor

charger in electric vehicle

In late September, California announced a new requirement for the sale of all new passenger vehicles to be zero-emission by 2035. While that’s still 15 years away, the executive order created quite a buzz in the automotive industry, reigniting conversations about electric vehicles (EVs) and the current market penetration of the most common zero-emission vehicles.

With that in mind, we wanted to take a closer look at the state of EVs—across the country and more specifically, in California—to better understand the EV market and how it’s grown over the past few years.

As of Q2 2020, electric vehicles comprised just 0.312% of vehicles in operation (VIO). While EV market share seems small, there has been significant growth since Q2 2015, when they only held 0.0678% of the VIO market—meaning the growth of EVs has more than tripled (3.6x) in the last five years. But even still, other segments, such as CUVs have seen faster growth in the same time period (10% market share in Q2 2020 compared to 6.2% in Q2 2015).

California sees faster EV adoption

California has seen growth in EV adoption in the last decade, but it has grown exponentially in the last five years. EVs comprised 1.79% of new vehicle registrations 2015, and the percentage grew to 5.32% as of Q2 2020. Much of the growth occurred between 2017 and 2018, when market share jumped from 2.62% to 5.04% year-over-year, with the introduction of the more cost-effective Tesla Model 3. Even with that growth, California new vehicle purchases have a long way to grow to move up to 100% EV.

With the popularity of the Model 3, it’s somewhat unsurprising, Tesla holds the lion’s share of the EV market in California, making up 61.9% of EVs on the road within VIO, and nationally at 64.8% share. That could potentially change down the road though. Over the next two years, numerous manufacturers have plans to introduce electric versions of popular models or introduce new EV models altogether. This not only creates competition but could also help continue to drive down vehicle cost, making EVs a more viable option for consumers.

Examining costs and other factors

Cost is one of the key considerations that industry experts have routinely brought up over the years as a barrier to EV adoption. While some say that maintenance and fuel are cheaper in the long run, purchasing an EV today is typically a more expensive option at the dealership. The average loan amount for an EV in California in 2019 was $40,964, compared to an average vehicle loan amount of $32,373.

That said, as EV adoption has seen exponential growth in the last five years, the average price has reduced. The average loan amount for an EV in 2016 was $78,646, dropping more than $35,000 in just five years as the technology continued to mature and vehicle costs lowered. Additionally, tax incentives, particularly in California, have also helped reduce affordability concerns. Though today’s tax incentives may not be in place through 2035, California will likely need to evaluate if economic incentives are required along the way to achieving the zero-emission vehicle deadline.

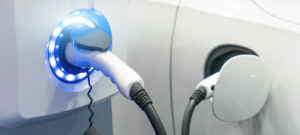
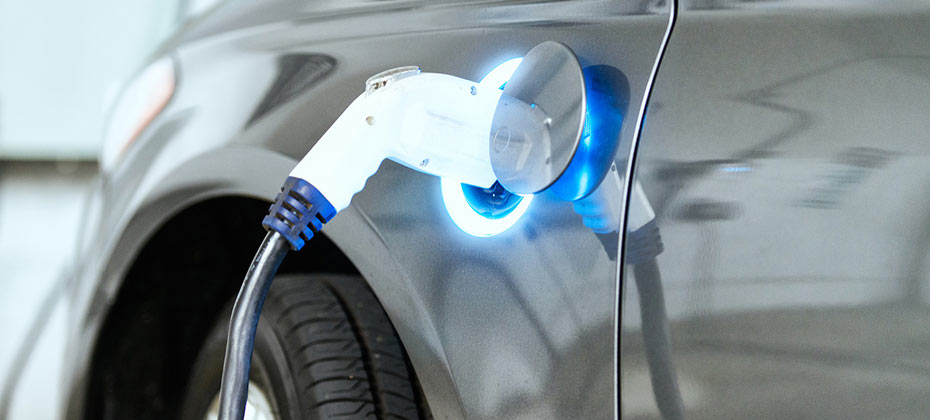
However, even as costs lower, there are additional challenges to be overcome. For instance, infrastructure continues to be a barrier to adoption. In a 2019 AAA study, concern over being able to find a place to charge is the top reason listed as to why respondents are unlikely to purchase an EV in the future. In addition, according to Statisa, in March 2020, the U.S. had almost 25,000 charging stations for plug-in electric vehicles, and approximately 78,500 charging outlets. Of those charging stations, nearly 30% are in California. But with continued growth of EV sales, there will be a critical need for continued infrastructure nationwide—not just in California.

In addition to these considerations, many impacts of the new mandate remain unknown. California will have to navigate increased electricity demand—especially during peak hours—and increases in battery scrappage, as EVs wear out. Gas stations will need to manage a loss of revenue, while changes in fuel taxes are likely, and vehicle technicians will require new training.

If increased adoption of zero emission vehicles is California’s long-term goal, this could also impact the popularity of used vehicles, which could leave dealers looking for alternative locations to sell their gasoline-powered inventory.

Looking toward the future of EVs

Realistically, with 15 years until the mandate takes effect, the California mandate won’t have much of an immediate effect on the industry. But it does highlight key considerations for automakers and the aftermarket moving forward. To achieve better adoption rates, automakers need to understand the barriers to success and how they impact consumer behavior. An example of this is how California has seen higher EV adoption rates as the availability of plug-in stations has increased.

Continuing to find ways to lower costs and focusing on savings over the lifetime of the vehicle is will help consumers see the value of an EV. At the end of the day, automakers play a large role in moving the country toward EV adoption, so having a clear understanding of the trends can help refine strategies as we move toward an electrified future.

Related Posts

While the dynamics of the electric vehicle (EV) market continue to drive headlines, recent data reveals that although EV registrations remain steady, hybrids are becoming a practical bridge between gas-powered vehicles and EVs. Experian’s Automotive Consumer Trends Report: Q2 2025 found EVs accounted for 9.2% of new retail registrations, down from 10.5% in Q2 2024, and gas-powered vehicles declined from 73.7% to 71.9% year-over-year. Meanwhile, hybrids jumped from 15.8% to 18.9% in the same time frame. Digging a bit deeper, one of the most telling insights from the data was the apparent transition that consumers make when returning to the market for another vehicle purchase. The data shows that as consumers become familiar with alternative fuel types, some “graduate” into more electrified vehicles. For example, nearly 13% of gas-powered vehicle owners replaced their vehicle with a hybrid (10.8% for hybrids and 2.0% for plug-in hybrids [PHEV], respectively). Meanwhile, 52.2 % of hybrid owners returned to the market to purchase another hybrid and 5.0% returned to purchase a PHEV.  Further along in the electrified vehicle funnel, we’re seeing 11.0% of PHEV owners returning to market to purchase a hybrid, while 31.7% returned to purchase another PHEV and 22.2% purchase an EV. Most EV households are not exclusively electric Data in the second quarter of this year found 80% of EV-owning households also have a gas-powered vehicle and 14.9% also own a hybrid, demonstrating that consumers are looking for ways to accommodate their diverse driving needs. While the interest in EVs remains strong, many consumers still rely on more traditional fuel types for various reasons. Though, hybrids are notably becoming a middle ground solution as they offer fuel efficiency without the other concerns that can accompany an EV. As alternative fuel types continue to create a household name in the automotive industry, hybrids are starting to play a notable role in the transition to electrification. Data from this quarter not only shows that consumers are experimenting with alternative fuel types, but they’re also integrating them into multi-vehicle households. With their growing popularity reflects a pragmatic approach to balancing the latest innovation with everyday practicality, hybrids may be the key steppingstone that brings mainstream consumers closer to the electrified space. To learn more about alternative fuel type insights, view the full Automotive Consumer Trends Report: Q2 2025 presentation.  

Published: September 16, 2025 by Kirsten Von Busch

In an ever-evolving automotive landscape, where shifting consumer behavior meets fluctuating market dynamics, Experian’s State of the Automotive Finance Market Report: Q2 2025 delivers key insights into how both consumers and professionals are adapting to the changes. This quarter’s report revealed a sharp increase in vehicle refinancing—up nearly 70% from Q2 2024—as consumers capitalized on the more stable rate environment. In fact, after refinancing, the average interest rate went from 10.45% to 8.45%. That shift resulted in their monthly payment dropping by an average of $71. Interestingly, credit unions played a significant role in the refinance surge, increasing their market share from 63.22% last year to 68.33% this quarter, and borrowers who refinanced through credit unions saw their monthly payments decrease by $87 on average. Banks saw a slight dip in their share of the refinancing market year-over-year, going from 22.71% to 21.45%, and borrowers who refinanced through them saved an average of $46 a month. New leaders emerge as the lender market share continues to evolve Taking a deeper dive into the automotive finance market share, banks reclaimed their leading position for total vehicle financing, rising to 27.50% in Q2 2025, from 24.50% in Q2 2024. Meanwhile, captives declined from 30.17% to 26.63% year-over-year, and credit unions slightly increased from 20.35% to 21.04% during the same period. For new vehicles, captives continued to lead at 52.39% this quarter, though it was a drop from 60.74% last year. On the other hand, banks grew from 21.12% to 25.91% and credit unions went from 9.99% to 12.24% in the same time frame. On the used side, banks edged ahead, increasing their share to 28.59% in Q2 2025, from 26.80% last year. Credit unions saw slight growth from 27.59% to 27.63%, while captives declined from 7.83% to 6.40% year-over-year. As affordability remains a key priority, consumers seem to be exploring financing options that offer more favorable terms. While Experian Automotive’s report continues to illustrate the evolving dynamics, these data-driven insights can empower both consumers and industry professionals to make smarter financial decisions. To learn more about automotive finance trends, view the full State of the Automotive Finance Market Report: Q2 2025 presentation on demand.

Published: September 5, 2025 by Melinda Zabritski

Executive Summary The July 2025 housing market reveals a landscape of shifting consumer behaviors, evolving lender strategies, and continued strength in borrower performance—especially within home equity. Origination volumes have dipped slightly, but direct marketing, particularly through Invitation to Apply (ITA) campaigns, is accelerating. As key players exit the space, gaps are opening across both marketing and origination, creating clear opportunities for agile institutions. This phase signals both caution and potential. The winners will be those who refine their marketing, sharpen segmentation, and deploy smarter risk monitoring in real time. TL;DR Risk Profile: Mortgage and HELOC delinquencies remain low. Slight increases in 90+ DPD are not yet cause for concern. Mortgage Originations: Modestly down, but marketing remains aggressive. Invitation to Apply (ITA) volumes outpacing prescreen. Home Equity Originations: Stable originations, competitive marketing volumes. ITA volumes outpacing prescreen similar to mortgage. Opportunity: Targeted direct mail and refined segmentation are growth levers in both mortgage and home equity. Risk Environment: Resilient Yet Watchful Experian’s July data shows both mortgage and home equity delinquencies hovering at historically low levels. Early-stage delinquencies dropped in June, while late-stage (90+ days past due) nudged upward—still below thresholds signaling broader distress. HELOCs followed a similar path. Early-stage movement was slightly elevated but well within acceptable ranges, reinforcing borrower stability even in a high-rate, high-tariff environment. Takeaway: Creditworthiness remains strong, especially for real estate–backed portfolios, but sustained monitoring of 90+ DPD trends is smart risk management. Home Equity: Volume Holds, Competition Resets Home equity lending is undergoing a major strategic reshuffle. With a key market participant exiting the space, a significant share of both marketing and originations is now in flux. What’s happening: Direct mail volumes in home equity nearly match those in first mortgages—despite the latter holding larger balances. ITA volumes alone topped 8 million in May 2025. Total tappable home equity stands near $29.5 trillion, underscoring a massive opportunity.(source: Experian property data.) Lenders willing to recalibrate quickly can unlock high-intent borrowers—especially as more consumers seek cash flow flexibility without refinancing into higher rates.   Direct Mail and Offer Channel Trends The continued surge in ITA campaigns illustrates a broader market pivot. Lenders are favoring: Controlled timing and messaging Multichannel alignment Improved compliance flexibility May 2025 Mail Volumes: Offer Type Mortgage Home Equity ITA 29.2M 25.8M Prescreen 15.6M 19.0M Strategic Insights for Lenders 1. Invest in Personalized Offers Drive better response rates with prescreen or ITA campaigns. Leverage data assets like Experian ConsumerView for ITA’s for robust behavioral and lifestyle segmentation. For prescreen, achieve pinpoint-personalization with offers built on propensity models, property attributes, and credit characteristics. 2. Seize the Home Equity Opening Use urgency-based messaging to attract consumers searching for fast access to equity—without the complexity of a full refi. Additionally, as mentioned above, leverage propensity, credit, and property (i.e. equity) data to optimize your marketing spend. 3. Strengthen Risk Controls Even in a low-delinquency environment, vigilance matters. Account Review campaigns, custom scorecards, and real-time monitoring help stay ahead of rising 90+ DPD segments. 4. Benchmark Smarter Competitive intelligence is key. Evaluate offer volumes, audience segmentation, and marketing timing to refine your next campaign. FAQ Q: What does the exit of a major home equity player mean? A: It leaves a significant gap in both marketing activity and borrower targeting. Lenders able to act quickly can capture outsized share in a category rich with equity and demand. Q: How should lenders respond to the evolving risk profile? A: Continue to monitor performance closely, but focus on forward-looking indicators like trended data, income verification, and alternative credit signals. Conclusion The housing market in July 2025 presents a clear message: the fundamentals are sound, but the strategies are shifting. Those ready to optimize outreach by making smarter use of data will seize a disproportionate share in both mortgage and home equity. Want to stay ahead? Connect with Experian Mortgage Solutions for the insights, tools, and strategies to grow in today’s evolving lending environment.  

Published: August 29, 2025 by Jonathan Reese

Subscribe to our Auto blog

Enter your name and email for the latest updates.

This site is protected by reCAPTCHA and the Google Privacy Policy and Terms of Service apply.