Topics

According to Experian Marketing Services' annual Email Market Study, personalized promotional emails have 29 percent higher unique open rates and 41 percent higher unique click rates than nonpersonalized mailings.
While access to small-business credit is improving and credit balances are increasing, key differences still remain across the United States.
Using a risk model based on older data can result in reduced predictive power.
The housing market continues to recover, with mortgage originations increasing 12 percent year over year, moving from $508 billion to $570 billion.
Small-business credit conditions wrapped up the year by showing continued improvement for the fourth consecutive quarter.
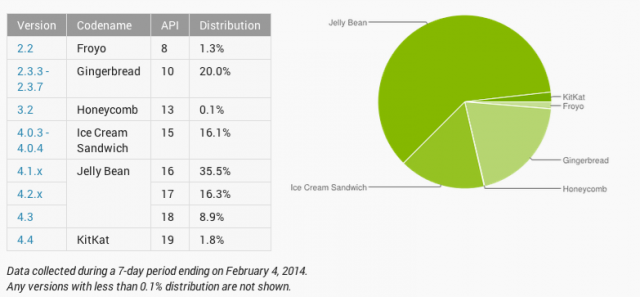
Both Visa and MasterCard announced their support for Host Card Emulation (HCE) and their intent to release HCE specifications soon. I have been talking about HCE from late 2012 (partly due to my involvement with SimplyTapp) and you could read as to why HCE matter and what Android KitKat-HCE announcement meant for payments. But in light of the network certification announcements yesterday, this post is an attempt to provide some perspective on what the Visa/MasterCard moves mean, how do their approaches differ in certifying payments using cloud hosted credentials, what should issuers expect from a device and terminal support perspective, why retailers should take note of the debate around HCE and ultimately – the role I expect Google to continue to play around HCE. All good stuff. First, what do the Visa/MasterCard announcements mean? It means that it’s time for banks and other issuers to stop looking for directions. The network announcements around HCE specifications provide the clarity required by issuers to meaningfully invest in mobile contactless provisioning and payment. Further, it removes some of the unfavorable economics inherited from a secure element-centric model, who were forced to default to credit cards with higher interchange in the wallet. Renting space on the secure element cost a pretty penny and that is without taking operational costs in to consideration, and as an issuer if you are starting in the red out of the gate, you were not about to put a Durbin controlled debit card in the wallet. But those compulsions go with the wind now, as you are no longer weighed down by these costs and complexities on day one. And further, the door is open for retailers with private label programs or gift cards to also look at this route with a lot more interest. And they are. MasterCard mentioned bank pilots around HCE in its press release, but MCX is hardly the only retailer payment initiative in town. Let me leave it at that. How do the Visa/MasterCard specs differ? From the press releases, some of those differences are evident – but I believe they will coalesce at some point in the future. MasterCard’s approach speaks to mobile contact-less as the only payment modality, whereas Visa refers to augmenting the PayWave standard with QR and in-app payments in the future. Both approaches refer to payment tokens (single or multi-use) and one can expect them to work together with cloud provisioned card profiles, to secure the payment transaction and verify transactional integrity. To MasterCard’s benefit – it has given much thought to ensuring that these steps – provisioning the card profile, issuing payment tokens et al – are invisible to the consumer and therefore refrains from adding undue friction. I am a purist at heart – and I go back to the first iteration of Google Wallet – where all I had to do to pay was turn on the screen and place the device on the till. That is the simplicity to beat for any issuer or retailer payment experiences when using contactless. Otherwise, they are better off ripping out the point-of-sale altogether. MasterCard’s details also makes a reference to a PIN. The PIN will not be verified offline as it would have been if a Secure Element would have been present in the device, rather – it would be verified online which tells me that an incorrect PIN if input would be used to create an “incorrect cryptogram” which would be rejected upstream. Now I am conflicted using a PIN at the point of sale for anything – to me it is but a Band-Aid, it reflects the inability to reduce fraud without introducing friction. Visa so far seems to be intentionally light on details around mandating a PIN, and I believe not forcing one would be the correct approach – as you wouldn’t want to constrain issuers to entering a PIN as means to do authentication, and instead should have laid down the requirements but left it to the market to decide what would suffice – PIN, biometrics et al. Again – I hope these specs will continue to evolve and move towards a more amenable view towards customer authentication. Where do we stand with device and terminal support? All of this is mute if there are not enough devices that support NFC and specifically – Android KitKat. But if you consider Samsung devices by themselves (which is all one should consider for Android) they control over 30% of the NA market – 44.1 million devices sold in 2013 alone. Lion share of those devices support NFC out of the box – including Galaxy Note II and 3, Galaxy S3 and S4 – and their variants mini, Active, Xoom et al. And still, the disparity in their approach to secure elements, continuing lack of availability in standards and Android support – Tap and Pay was largely a dream. What was also worrisome is that 3 months after the launch of Android KitKat – it still struggles under 2% in device distribution. That being said, things are expected to get markedly better for Samsung devices at least. Samsung has noted that 14 of its newer devices will receive KitKat. These devices include all the NFC phones I have listed above. Carriers must follow through quickly (tongue firmly in cheek) to deliver on this promise before customers with old S3 devices see their contracts expire and move to a competitor (iPhone 6?). Though there was always speculation as to whether an MNO will reject HCE as part of the Android distribution, I see that as highly unlikely. Even carriers know a dead horse when they see one, and Isis’s current model is anything but one. Maybe Isis will move to embrace HCE. And then there is the issue of merchant terminals. When a large block of merchants are invested in upending the role of networks in the payment value chain – that intent ripples far and wide in the payments ecosystem. Though it’s a given that merchants of all sizes can expect to re-terminalize in the next couple of years to chip & pin (with contactless under the hood) – it is still the prerogative of the merchant as to whether the contactless capability is left turned on or off. And if merchants toe Best Buy’s strategy in how it opted to turn it off store-wide, then that limits the utility of an NFC wallet. And why wouldn’t they? Merchants have always viewed “Accept all cards” to also mean “Accept all cards despite the form factor” and believes that contactless could come to occupy a higher interchange tier in the future – as questions around fraud risk are sufficiently answered by the device in real-time. This fear is though largely unsubstantiated, as networks have not indicated that they could come to view mobile contact-less as being a “Card Present Plus” category that charges more. But in the absence of any real assurances, fear, uncertainty and doubt runs rampant. But what could a retailer do with HCE? If re-terminalization is certain, then retailers could do much to explore how to leverage it to close the gap with their customer. Private label credit, closed loop are viable alternatives that can be now carried over contactless – and if previously retailers were cut out of the equation due to heavy costs and complexity for provisioning cards to phones, they have none of those limitations now. A merchant could now fold in a closed loop product (like a gift card) in to their mobile app – and accept those payments over contact-less without resorting to clunky QR or barcode schemes. There is a lot of potential in the closed loop space with HCE, that Retailers are ignoring due to a “scorched earth” approach towards contactless. But smarter merchants are asking ‘how’. Finally, what about Google? Google deserves much praise for finally including HCE in Android and paving the way for brands to recognize the opportunity and certify the approach. That being said, Google has no unequal advantage with HCE. In fact, Google has little to do with HCE going forward, despite GoogleWallet utilization of HCE in the future. I would say – HCE has as much to do with Google going forward, as Amazon’s Kindle Fire has to do with Android. Banks and Retailers have to now decide what this means for them – and view HCE as separate to Google – and embrace it if they believe it has potential to incent their brands to remain top of wallet, and top of mind for the consumer. It is a level playing field, finally. Where do you go next? Indeed – there is a lot to take in – starting with HCE’s role, where it fit in to your payment strategy, impact and differences in Visa/MasterCard approaches, weaving all of these in to your mobile assets while not compromising on customer experience. Clarity and context is key and we can help with both. Reach out to us for a conversation. HCE is a means to an end – freeing you from the costs and complexities of leveraging contactless infrastructure to deliver an end-to-end mobile experience, but there is still the question of how your business should evolve to cater to the needs of your customers in the mobile channel. Payment is after all, just one piece of the puzzle.

By: Matt Sifferlen On January 17th, we celebrated the 308th birthday of one of America's most famous founding fathers, Ben Franklin. I've been a lifelong fan of his after reading his biography while in middle school, and each year when his birthday rolls around I'm inspired to research him a bit more since there is always something new to learn about his many meaningful contributions to this great nation. I find Ben a true inspiration for his capacity for knowledge, investigation, innovation, and of course for his many witty and memorable quotes. I think Ben would have been an exceptional blogger back in his day, raising the bar even higher for Seth Godin (one of my personal favorites) and other uber bloggers of today. And as a product manager, I highly respect Ben's lifelong devotion to improving society by finding practical solutions to complex problems. Upon a closer examination of many of Ben's quotes, I now feel that Ben was also a pioneer in providing useful lessons in commercial fraud prevention. Below is just a small sampling of what I mean. “An ounce of prevention is worth a pound of cure” - Preventing commercial fraud before it happens is the key to saving your organization's profits and reputation from harmful damage. If you're focused on detecting fraud after the fact, you've already lost. “By failing to prepare, you are preparing to fail.” - Despite the high costs associated with commercial fraud losses, many organizations don't have a process in place to prevent it. This is primarily due to the fact that commercial fraud happens at a much lower frequency than consumer fraud. Are you one of those businesses that thinks "it'll never happen to me?" “When the well’s dry, we know the worth of water.” - So you didn't follow the advice of the first two quotes, and now you're feeling the pain and embarrassment that accompanies commercial fraud. Have you learned your lesson yet? “After crosses and losses, men grow humbler and wiser.” Ah, no lender likes losses. Nothing like a little scar tissue from "bad deals" related to fraud to remind you of decisions and processes that need to be improved in order to avoid history repeating itself. “Honesty is the best policy.” - Lots of businesses stumble on this part, failing to communicate when they've been compromised by fraud or failing to describe the true scope of the damage. Be honest (quickly!) and set expectations about what you're doing to limit the damage and prevent similar instances in the future. “Life’s tragedy is that we get old too soon and wise too late.” - Being too late is a big concern when it comes to fraud prevention. It's impossible to prevent 100% of all fraud, but that shouldn't stop you from making sure that you have adequate preventive processes in place at your organization. “Never leave that till tomorrow which you can do today.” - Get a plan together now to deal with fraud scenarios that your business might be exposed to. Data breaches, online fraud and identity theft rates are higher than they've ever been. Shame on those businesses that aren't getting prepared now. “Beer is living proof that God loves us and wants us to be happy.” - I highly doubt Ben actually said this, but some Internet sites attribute it to him. If you already follow all of his advice above, then maybe you can reward yourself with a nice pale ale of your choice! So Ben can not only be considered the "First American," but he can also be considered one of the first fraud prevention visionaries. Guess we'll need to add one more thing to his long list of accomplishments!
Delinquency rates for auto loans moved up slightly in the last quarter of 2013, with the 30 to 59 days past due (DPD), 60 to 89 DPD and 90 to 180 DPD delinquency rates at 2.18 percent, 0.56 percent and 0.24 percent, respectively.
The volume of emails sent by marketers rose nearly 13 percent during the 2013 holiday season compared to 2012.

An employee who never uses a mobile device – personal or company-supplied – for business purposes is becoming a rare creature, indeed. Use of mobile devices is prevalent across virtually every industry, and the convenience and flexibility these devices offer professionals can be great for business. Provided, that is, those devices are secure. Mobile devices continue to be a significant source of data breaches, and a particular concern for anyone engaged in cyber security, according to eSecurity Planet’s Data Breach Roundup. Mobile-related data breaches stem from a range of circumstances, including loss or theft of devices, failure to use anti-malware, or failing to password-protect a device being used for business purposes. Devices can put your data at risk if an employee stores any proprietary information on a mobile device, or if workers use unsecured devices to access your network – even if you’ve taken steps to secure the network itself. Managing mobile devices can be one of the most challenging aspects of your overall cyber security program, but it’s imperative and – fortunately – not impossible. Minimizing mobile device risks CTIA, The Wireless Association, offers some guidelines for mobile device cyber security in its whitepaper “Today’s Mobile Cybersecurity: Blueprint for the Future.” The organization points to five cornerstones of mobile cyber security: Education about the importance of mobile security Devices with security features like anti-malware and anti-spam settings Strong, enforced network security policies Authentication for all network users Secure connections, from cloud to network Many tools exist to help your organization ensure secure footing on each of those cornerstones. CTIA cites options like risk management, security policies and monitoring. We would add to that list, and emphasize the importance of a data breach response plan that addresses the specific challenges and risks associated with a mobile-spurred data breach incident. While your organization can take strong, reasoned steps toward minimizing risks, it’s equally important to be ready to respond when a breach occurs. Mobile device security is sure to be a growing issue throughout 2014, as more people than ever use smartphones, tablets and other mobile devices to work more efficiently. With the right precautions, you can help ensure your employees work safely, as well. Learn more about our Data Breach solutions
In the days following the Target breach, both clarity and objectivity are in short supply. Everything that didn’t already exist became suddenly the cure-all – EMV being one. Retailers bristle, albeit in private – due to the asymmetry in blame they have come to share compared to banks – despite having equal ownership of the mess they have come to call payments. Issuers and Schemes scramble to find an empty deck chair on the Titanic, just to get a better view of the first of the lifeboats capsizing. Analogies aside, we may never fully eliminate breaches. Given an infinite amount of computing power and equal parts human gullibility – whether its via brute forcing encryption systems or through social engineering – a breach is only a matter of time. But we can shorten the half-life of what is stolen. And ensure that we are alerted when breaches occur – as fraudsters take care to leave little trace behind. Yet today our antiquated payments system offer up far too many attack vectors to a fraudster, that the sophistication in attempts of the likes of what we saw at Target, is the exception and not the norm. But are the retailers absolved of any responsibility? Hardly. Questions from a breach: According to Target, malware was found on Target’s PoS – presumably pushed by unauthorized outsiders or via compromised insiders. If so, how is it that unauthorized code managed to find its way to all or most of its PoS terminals? Could this have been uncovered by performing a binary or checksum comparison first, to ensure that files or packages are not tampered with, before they are deployed to the Point-of-Sale? Such a step could have certainly limited the attack vectors to a small group of people with administrative access – who would have the need to handle keys and checksums. Further, depending on the level of privilege accorded to every binary that gets deployed to the point of sale – Target could have prevented an unauthorized or remotely installed program from performing sensitive functions such as reading consumer data – either in transit or in RAM. That said – I am not sure if PoS manufacturers provide for such layered approach towards granting access and execution privileges to code that is deployed to their systems. If not, it should. Where DOES EMV come in? EMV helps to verify the card – indisputably. Beyond that, it offers no protection to either the consumer or the merchant. The risk of EMV, and it’s infallibility in the eyes of its true believers, is that it can lull the general public in to a sense of false security – much like what we have now under Reg E and Reg Z. With EMV, PAN and PIN continues to be passed in the clear, unencrypted. Retailers could deploy EMV terminals and still be riddled like cheese by fraudsters who can siphon off PANs in transit. Fraudsters who may find it nearly impossible to create counterfeit cards, instead will migrate online where inadequate fraud mitigation tools prevail – and those inadequacies will force both banks and retailers to be heavy handed when it comes to determining online fraud. Friction or Fraud should not be the only two choices. Solving Card Not Present Fraud: There are no silver bullets to solve Card Not Present fraud. Even with EMV Chip/Pin, there is an opportunity to put a different 16 digit PAN on the front of the card versus the one that is on the magstripe/chip. (I am told that Amex does this for its Chip/pin cards.) The advantage is that a fraudster using a fraudulently obtained PAN from the chip for an e-commerce purchase will standout to an card issuer compared to the legit customer using a different PAN on the front of the card for all her e-commerce purchases. This maybe one low tech way to address CNP fraud alongside of an EMV rollout. But if asking a consumer to enter his Zipcode or show his ID was enough for retail purchases, there exists equivalent friction-bound processes online. Authentication services like 3-D Secure are fraught with friction, and unfairly penalize the customer and indirectly – the retailer and issuer, for its blind attribution of trust in a user provided password or a token or a smart card reader. Where it may (in some cases) undeniably verifies consumer presence, it also overwhelms – and a customer who is frustrated with a multi-step verification will simply shop somewhere else or use Paypal instead. Ever had to input your Credit Card Verification code (CVV2 or CVC2) on an Amazon purchase? Me neither. Fraud in connected commerce: As connected devices outnumber us, there needs to be an approach that expands the notion of identity to look beyond the consumer and start including the device. At the core, that is what solutions like 41st Parameter – an Experian company, focuses on – which enables device attributes to collectively construct a more sophisticated indicator of fraud in an e-commerce transaction – using 100 or so anonymous device attributes. Further it allows for more nuanced policies for retailers and issuers, to mitigate fraud by not only looking at the consumer or device information in isolation – but in combination with transactional attributes. As a result, retailers and issuers can employ a frictionless, smarter, and more adaptive fraud mitigation strategy that relies less on what could be easily spoofed by a fraudster and more on what can be derived or implied. If you want to know more why this is a more sensible approach to fighting fraud, you should go here to read more about 41st Parameter. Remnants from a breach: Even though the material impact to Target is still being quantified, little doubt remains as to the harm done to its reputation. Target RED card remains largely unaffected, yet it is but a fleeting comfort. Though some, thus had been quick to call decoupled debit a more secure product, those claims choose to ignore the lack of any real consumer protection that is offered alongside of these products. Though Reg E and Reg Z have been largely instrumental in building consumer trust in credit and debit cards, they have also encouraged general public to care less about fraud and credit card security. And this affects more than any other – MCX, whose charter calls for reduction of payment acceptance costs first, and to whom – decoupled debit offered a tantalizing low cost alternative to credit. But when it launches this year, and plans to ask each customer to waive protections offered by Reg E and Reg Z and opt for ACH instead – those consumers will find that choice harder to stomach. Without offering consumers something equivalent, MCX Retailers will find it exceedingly difficult to convince customers to switch. Consumer loyalty to retailer brands was once given as the reason for creating a retailer friendly payment backbone, but with Target’s reputation in tatters – that is hardly something one can bank on these days – pun intended. Where does this leave us? To be completed… This blog post was originally featured at: http://www.droplabs.co/?p=964
According to Experian Marketing Services’ holiday peak week analysis, social media proved to be a key research tool for holiday shoppers and a crucial driver of traffic to retail Websites.
By: Teri Tassara In my blog last month, I covered the importance of using quality credit attributes to gain greater accuracy in risk models. Credit attributes are also powerful in strengthening the decision process by providing granular views on consumers based on unique behavior characteristics. Effective uses include segmentation, overlay to scores and policy definition – across the entire customer lifecycle, from prospecting to collections and recovery. Overlay to scores – Credit attributes can be used to effectively segment generic scores to arrive at refined “Yes” or “No” decisions. In essence, this is customization without the added time and expense of custom model development. By overlaying attributes to scores, you can further segment the scored population to achieve appreciable lift over and above the use of a score alone. Segmentation – Once you made your “Yes” or “No” decision based on a specific score or within a score range, credit attributes can be used to tailor your final decision based on the “who”, “what” and “why”. For instance, you have two consumers with the same score. Credit attributes will tell you that Consumer A has a total credit limit of $25K and a BTL of 8%; Consumer B has a total credit limit of $15K, but a BTL of 25%. This insight will allow you to determine the best offer for each consumer. Policy definition - Policy rules can be applied first to get the desirable universe. For example, an auto lender may have a strict policy against giving credit to anyone with a repossession in the past, regardless of the consumer’s current risk score. High quality attributes can play a significant role in the overall decision making process, and its expansive usage across the customer lifecycle adds greater flexibility which translates to faster speed to market. In today’s dynamic market, credit attributes that are continuously aligned with market trends and purposed across various analytical are essential to delivering better decisions.
With most lenders focused on growth as the top priority for the new year, having the ability to score more consumers is key.
According to the National Christmas Tree Association, approximately 25 to 30 million real Christmas trees are sold annually in the United States versus 8 to 11 million artificial trees.