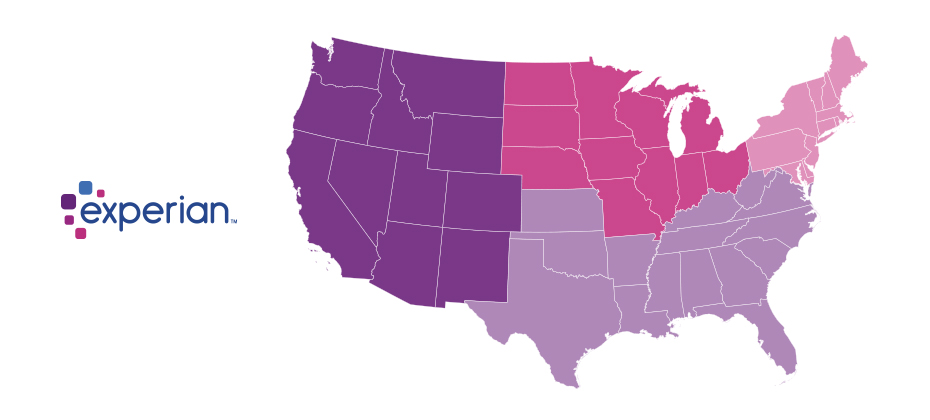
Florida, Delaware, Oregon and New York were the riskiest states for e-commerce fraud
 Miami accounted for the most ZIP Codes ranked across shipping and billing fraud.
Where is e-commerce fraud taking place? Everywhere.
Last year we reported that 2016 e-commerce fraud attack rates were on pace to surpass the 2015 totals. At the time, the fraud attack rates for the first half of 2016 appeared to be at least 15% higher than the 2015 total. That percentage turned out to be much higher as e-commerce fraud increased to 33% in 2016 compared to 2015 according to Experian data.
See the top 100 riskiest cities in the United States.
Download the list today
Experian analyzed millions of e-commerce transactions from our 2016 client data to identify fraud attack rates for both shipping and billing locations across the United States. The data reveals the increase of e-commerce attacks in 2016, the geographical differences, and whether a credit card has been stolen or personal credentials have been compromised. Fraud attack rates represent the attempted fraudulent e-commerce transactions against the population of overall e-commerce orders.
The 2016 e-commerce fraud attack rate data shows:
- Miami, FL., is where the riskiest ZIP™ Code comes from for both shipping and billing e-commerce fraud. Miami accounted for 17 of the top 100 ZIP™ Codes for shipping fraud and 20 of the top 100 for billing fraud.
- 70% of e-commerce billing fraud came from three states – Florida, California and New York – based on the sum of fraud attacks
- Delaware, Oregon, and Florida were the top-ranked states for billing and shipping e-commerce fraud in 2016
- Oregon and Delaware saw an increase in e-commerce billing fraud attacks of over 200%.
Many of the higher-risk ZIP™ codes and cities are located near a large port-of-entry city or airport, making them ideal locations for reshipping fraudulent goods. This includes Miami, Houston, New York City, and Los Angeles, perhaps allowing criminals to move stolen goods more effectively. All those cities are ranked among the riskiest cities for both measures of fraud attacks.
.dataTb{margin:20px auto;width:100%}.dataTb:after{clear:both}.dataTb table{}.dataTb td,.dataTb th{border:1px solid #ddd;padding:.8em}.dataTb th{background:#F4F4F4}.tbL{float:left;width:49%}.tbR{float:right;width:49%;margin:0 0 0 2%}
| Top 10 riskiest Billing ZIP™ Codes for 2016 | |
|---|---|
| 33198 | Miami, FL |
| 33192 | Miami, FL |
| 33195 | Miami, FL |
| 33166 | Miami, FL |
| 91733 | South El Monte, CA |
| 33191 | Miami, FL |
| 91746 | La Puente, CA |
| 17064 | Port Reading, NJ |
| 66025 | Eudora, KS |
| 89423 | Minden, NV |
| Source: Experian.com | |
| Top 10 riskiest Shipping ZIP™ Codes for 2016 | |
|---|---|
| 33198 | Miami, FL |
| 33166 | Miami, FL |
| 33191 | Miami, FL |
| 33195 | Miami, FL |
| 77036 | Houston, TX |
| 33192 | Miami, FL |
| 91733 | South El Monte, CA |
| 91746 | La Puente, CA |
| 66025 | Eudora, KS |
| 62694 | Winchester, IL |
| Source: Experian.com | |
What is driving credit card fraud trends?
The biggest component of this trend is the fact that 2016 was a record year for data breaches. There were 1,093 data breaches last year, a 40% increase from 2015, according to the Identity Theft Resource Center. The recent Federal Trade Commission (FTC) 2016 Consumer Sentinel Network Data Book, announced a jump in consumers who reported that their stolen data was used for credit card fraud, from 16% in 2015 to more than 32% in 2016. The record number of data breaches is a signal that future fraudulent activities will take place. This is further reflected by the increase of consumers reporting credit card fraud to the FTC in 2016. So far in 2017, that same trend continues as the total number of breaches has increased 56% compared to the same time in 2016.
Compare fraud attack rates — and more — from 2015 to 2016 in our latest infographic.
Download today
Why are there geographical differences in ecommerce fraud?
Most e-commerce merchants have basic controls in place to validate that transaction billing information matches a particular account holder using things like the address verification service. So from a billing or victim perspective, attackers typically leverage the legitimate cardholder billing details in a fraudulent order. In order to maximize successful fraud attacks, they need to make the transaction appear as normal as possible. But from a shipping perspective, those same fraudsters often can’t rely on shipping to the cardholder’s address and trying to intercept the package. To acquire the proceeds of their fraudulent transactions, this is where attackers get creative, often using re-shippers or shipping “mules”, freight forwarders, or delivery addresses that do not raise suspicion but are nearby international ports or airports so the fraudulent order can be quickly picked up and shipped to its final destination (often overseas). That’s why we see such a big disparity between attacks by a victim or billing address being mostly evenly spread across the country vs. shipping attacks, which are mostly concentrated in coastal states with major port cities and airports. Delaware and Oregon are two exceptions to this flattening of victim attacks, as both states saw a more than 200% increase in billing attacks with only modest increases in shipping attacks. From a shipping perspective, 10 states saw at least a 100% increase in fraudulent orders, having a significant impact on the overall population attack rate.
.dataTb{margin:20px auto;width:100%}.dataTb:after{clear:both}.dataTb table{}.dataTb td,.dataTb th{border:1px solid #ddd;padding:.8em}.dataTb th{background:#F4F4F4}.tbL{float:left;width:49%}.tbR{float:right;width:49%;margin:0 0 0 2%}
| Top 5 riskiest Billing fraud States | |
|---|---|
| State | Fraud Attack Rate |
| Delaware | 69.0 |
| Oregon | 65.7 |
| Florida | 41.1 |
| New York | 28.0 |
| Nevada | 27.0 |
| Source: Experian.com | |
| Top 5 riskiest Shipping fraud States | |
|---|---|
| State | Fraud Attack Rate |
| Delaware | 44.8 |
| Oregon | 43.2 |
| Florida | 34.2 |
| Alaska | 26.2 |
| Washington, D.C. | 25.8 |
| Source: Experian.com | |
Has the EMV switch affected fraud ecommerce rates at all?
The increase in e-commerce fraud follows a similar trend pattern from countries that previously rolled out EMV cards – UK, France, Australia, and Canada – that also saw gradual increases in card-not-present fraud. We suspect that the EMV liability switch and increased adoption by merchants of chip-and-pin enabled terminals have had a profound impact on driving up e-commerce attacks. Fraudsters that typically relied on committing counterfeit fraud have shifted their focus to the digital channels where they could have more success. As more fraud attackers enter a rapidly growing mobile and online commerce space, that makes it even more difficult for merchants to differentiate their good customers from the sophisticated fraud attackers.
Our annual fraud attack rate data brings to light the increase of e-commerce attacks over the last year across the US. This latest data is a strong indicator that other types of fraud have already occurred and can help businesses understand how to better protect themselves and their customers. Whether a credit card has been stolen or personal credentials have been compromised. Businesses need to expect an increase of e-commerce fraud over time and to be prepared.
If I run an ecommerce business what should I do to prevent fraud attacks like this?
Businesses need to anticipate an increase of e-commerce fraud over time and to be prepared. The value of employing a multi-layered approach to fraud prevention especially when it comes to authenticating consumers to validate transactions cannot be understated. By looking at all the points of the customer journey, businesses can better protect themselves from fraud, while maintaining a good consumer experience. Most importantly, having the right fraud solution in place can help businesses prevent losses both in dollars and reputation.
That layered fraud solution should pair transactional data elements with details about the user (and their previous history and behaviors), the device (and how they typically interact with the business and even understanding what the customers are purchasing and how it relates to the overall population of orders. Machine learning and automation are great complements in a holistic hybrid approach that pairs human intelligence and business rules with machine-based recommendations. We highly recommend that organizations partner with fraud experts who have visibility across peer organizations, the challenges facing the industry, and have been instrumental in solving those problems alongside merchants.