All posts by Guest Contributor

Cybersecurity has become one of the most significant issues impacting international security and political and economic stability. Our new report, Data Breach Industry Forecast 2018, outlines 5 predictions for the data breach industry in the coming year. Here are 3: The U.S. may experience its first large-scale attack on critical infrastructure, causing disruption for governments, companies and private citizens. Failure to comply with the new EU regulations will result in large penalties for U.S. companies. Attackers will use artificial intelligence to render traditional multifactor authentication methods useless. Read all five predictions>

Auto originations continue to increase — particularly within prime categories. According to Experian’s latest State of the Automotive Finance Market report: Prime consumers grabbed the lion’s share of the total finance market, at 40.9%. Super-prime buyers showed the largest increase, reaching 20.2%. Consumers outside the prime category (credit score of 600 or lower) decreased to the lowest share on record since 2012. Credit unions and captive lenders increased market share of total vehicle financing, growing to 21% and 29.8% — an increase of 6.9% and 35.1%, respectively. As auto loan originations continue their upward trend, lenders can stay ahead of the competition by using advanced analytics to target the right customers and increase profitability.

Traditional verification and validation parameters alone are not enough to stop identity fraud. Fortunately, there are many emerging trends and best practices for modern fraud and identity strategies: Applying right-sized fraud and identity proofing solutions to reduce user friction and manage fraud risk appropriately. Maintaining a universal user view by employing diverse breadth and depth of data assets and applied analytics. Expanding the user view through a blended ecosystem by collaborating with vendors, peer agencies, and partners in identity and fraud management. The future of identity proofing is more than just verifying individual identities. Check out our tip sheet linked below for more strategies. Modernize your fraud and identity strategies>

For most businesses, the customer experience is at the heart of every strategy. Debt collection shouldn’t be different. Here’s why: 21% of visits to an online debt recovery system were made outside the traditional working hours of 8 a.m. to 8 p.m. Of the consumers who committed to a repayment plan, only 56% did so in a single visit. PricewaterhouseCoopers reported that 46% of consumers use only digital channels to conduct banking, avoiding traditional offline channels. Conversely, data collected by Gallup between 2013 and 2016 showed that 48% of American banking customers would only consider using a bank that offered physical branches. The debt collection process is an often-overlooked opportunity to build customer relationships and loyalty. Leverage data and technology to replace outdated approaches, minimize charge-offs and create environments that value each customer. Learn more>

The credit card marketplace is a crowded and complex landscape. Recent research by Experian shows the average U.S. consumer has 3.1 credit cards and 2.5 retail cards, with an average balance of $6,354 and $1,841, respectively. So how can you build upon your existing customer relationships and offer the right products to the right people at the right time? By understanding consumer behavior. Pretty simple concept. But targeting viable consumers and making enticing offers takes some detective work. Gone are the days of demographic-based approach to audience segmentation for credit marketing campaigns. Consumers are now engaged on their smartphones, laptops, tablets, fitness bands, across countless apps, browsers, emails and more. Simply knowing a person’s gender and age doesn’t provide any information about how he spends the day, his consumer behaviors, personal interests, unique wants or needs. Developing rich consumer personas based on transaction credit data can be a powerful tool to understanding consumers so lenders can design more relevant and personalized credit offers, experiences and products to a very targeted audience. Experian DataLabs can help by analyzing transaction data to understand the consumers in your portfolio. For example, looking at your portfolio of 40-year-olds in the U.S. provides basic demographic information. A closer look at transaction data could reveal unique details within the age group to help you group and target, such as: Frequent travelers: These road warriors log serious miles. If they’re not traveling for work, they’re cashing in miles for vacation. This unique group leads your portfolio in airfare, cruise line, car rental, hotel and travel agency spend. With so much time spent away from home, this group is rarely found in grocery stores. Local business owners: Advertising, computer equipment, and software are typical expenses of this segmented group. There may be an opportunity to capture spend outside their business activity or to ensure they have the right card to fit their business needs. Constant commuters: These consumers use their card for local travel and transportation. And they are less likely to use their card for expenses related to other types of travel or maintaining a vehicle. After a long day, they like to grab a drink while waiting for the train. Online Shoppers: Consumers in this group use their card with various online merchants, including Amazon, Etsy, iTunes, and PayPal. Online shoppers are also above average spenders in elementary education, child care services, and family clothing. Social hipsters: They can be found meeting with friends for coffee and drinks, and are more likely to rely on local transportation and tend to eat out instead of cooking in. Effective audience segmentation ensures that your marketing dollars are invested in real people who are most likely to respond on certain media, have already expressed an interest in your product, and are geographically accessible to a specific retail location. Every campaign should be as dynamic and unique as its consumers. The powerful combination of consumer and transaction data allows you to customize audience segments to maximize customer engagement and drive campaign success.

Sophisticated criminals work hard to create convincing, verifiable personas they can use to commit fraud. Here are the 3 main ways fraudsters manufacture synthetic IDs: Credit applications and inquiries that build a synthetic credit profile over time. Exploitation of authorized user processes to take over or piggyback on legitimate profiles. Data furnishing schemes to falsify regular credit reporting agency updates. Fraudsters are highly motivated to innovate their approaches rapidly. You need to implement a solution that addresses the continuing rise of synthetic IDs from multiple engagement points. Learn more

With 81% of Americans having a social media profile, you may wonder if social media insights can be used to assess credit risk. When considering social media data as it pertains to financial decisions, there are 3 key concerns to consider. The ECOA requires that credit must be extended to all creditworthy applicants regardless of race, religion, gender, marital status, age and other personal characteristics. Social media can reveal these characteristics and inadvertently affect decisions. Social media data can be manipulated. Individuals can represent themselves as financially responsible when they’re not. On the flip side, consumers can’t manipulate their payment history. When it comes to credit decisions, always remember that the FCRA trumps everything. Data is essential for all aspects of the financial services industry, but it’s still too early to click the “like” button for social media. Make more insightful decisions with credit attributes>

Juniper Research recently recognized Experian as a Fraud Detection and Prevention Market Leader in its Online Payment Fraud Whitepaper. Juniper also shared important market insights in the report. The transactional value of card-not-present fraud is estimated to reach $19.3 billion in 2022. Online payment fraud is anticipated to grow 13.7% annually from 2017 to 2022. Digital banking fraud should reach $7.9 billion by 2022. $50.9 billion is expected to be spent on fraud detection and prevention software between 2017 and 2022. Fraud’s not going away anytime soon. Protecting your organization and customers is the new cost of doing business. Don’t wait until 2022 to start protecting yourself. Read the report>

Despite rising concerns about identity theft, most Americans aren’t taking basic steps to make it harder for their information to be stolen, according to a survey Experian conducted in August 2017: Nearly 3 in 4 consumers said they’re very or somewhat concerned their email, financial accounts or social media information could be hacked. This is up from 69% in a similar survey Experian conducted in 2015. Nearly 80% of survey respondents are concerned about using a public Wi-Fi network. Yet, barely half said they take the precaution of using a password-protected Wi-Fi network when using mobile devices. 59% of respondents are annoyed by safety precautions needed to use technology — up 12% from 2015. When your customer’s identity is stolen, it can negatively impact the consumer and your business. Leverage the tools and resources that can help you protect both. Protect your customers and your business>

Synthetic identity fraud is on the rise across financial services, ecommerce, public sector, health and utilities markets. The long-term impact of synthetic identity remains to be seen and will hinge largely upon forthcoming efforts across the identity ecosystem made up of service providers, institutions and agencies, data aggregators and consumers themselves. Making measurement more challenging is the fact that much of the assumed and confirmed losses are associated with credit risk and charge offs, and lack of common and consistent definitions and confirmation criteria. Here are some estimates on the scope of the problem: Losses due to synthetic identity fraud are projected to reach more than $800 million in 2017.* Average loss per account is more than $10,000.* U.S. synthetic credit card fraud is estimated to reach $1.257 billion in 2020.* As with most fraud, there is no miracle cure. But there are best practices, and topping that list is addressing both front- and back-end controls within your organization. Synthetic identity fraud webinar> *Aite Research Group

Our national survey found that consumers struggle to find a credit card that meets their needs. They say there are too many options and it’s too time-consuming to research. What do consumers want? With 53% of survey respondents not satisfied with their current cards and 1 in 3 saying they’re likely to get a new card within 6 months, now’s the time to start personalizing offers and growing your portfolio. Start personalizing offers today>

The collections space has been migrating from traditional mail and outbound calls to electronic payment portals, digital collections and virtual negotiators. Now that collectors have had time to test virtual collections, we’ve collected some data points. Here are a few: On average, 52% of consumers who visit a digital site will proceed to a payment schedule if the right offer is made. 21% of the visits were outside the core hours of 8 a.m. to 8 p.m., an indication that traditional business hours don’t always work. Of the consumers who committed to a payment plan, only 56% did it in a single visit. The remaining 44% did so mostly later that day or on a subsequent day. As more financial institutions test this new virtual approach, we anticipate customer satisfaction and resolutions will continue to climb. Get your debt collections right>

With 1 in 6 U.S. residents being Hispanic, now is a great time for financial institutions to reflect on their largest growth opportunity. Here are 3 misconceptions about the multifaceted Hispanic community that are prevalent in financial institutions: Myth 1: Hispanic consumers are only interested in transaction-based products. In truth, product penetration increases faster among Hispanic members compared with non-Hispanic members when there’s a strategic plan in place. Myth 2: Most Hispanics are undocumented. The facts show that of the country’s more than 52 million Hispanics, most are native-born Americans and nearly 3 in 4 are U.S. citizens. Myth 3: The law prevents us from serving immigrants. Actually, financial institutions can compliantly lend to individuals who have an Individual Taxpayer Identification Number. There are many forms of acceptable government-issued identification, such as passports and consular identification cards. Solidifying the right organizational mentality, developing a comprehensive strategy based on segmentation, and defining what success truly looks like. These are all part of laying the foundation for success with the Hispanic market. Learn more>

Direct mail is dead. It’s so 90s. Digital is the way to reach consumers. Marketers have heard this time and again, and many have shifted their campaign focus to the digital space. But as our lives become more and more consumed by digital media, consumers are giving less time and attention to the digital messages they receive. The average lifespan of an email is now just two seconds and brand recall directly after seeing a digital ad is just 44%, compared to direct mail which has a brand recall of 75%. Further research shows direct mail marketing is one of the most effective tools for customer acquisition and loan growth. The current Data & Marketing Association (DMA) response rate report reveals the direct mail response rates for 2016 were at the highest levels since 2003. Additionally, while mailing volume has trended down since October 2016, response rates have trended up, and reached 0.68% in March 2017, up from 0.56% in October 2016. Using data and insights to tailor a direct mail campaign can yield big results. Here are some attention-grabbing tips: Identify Your Target Market: Before developing your offer and messaging strategy, begin with the customer profile you are trying to attract. Propensity models and estimated interest rates are great tools for identifying consumers who are more likely to respond to an offer. Adding them as an additional filter to a credit-qualified population can help increase response rates. Verify your Mailing List: Experian’s address verification software validates the accuracy and completeness of a physical address, flags inaccuracies, and corrects errors before they can negatively impact your campaign. Personalize the Offer: Consumers are more likely to open offers that are personalized, and appeal to their life stage, organizational affiliations or interests. Experian’s Mosiac profile report is a simple, inexpensive way to gather data-based insight into the lifestyle and demographics of your audience. Time the Offer: Timing your campaign with peak market demand is key. For example, personal loan demand is highest in the first quarter after the holidays, while student loans demand peaks in the Spring. Direct mail can help overcome digital fatigue that many consumers are experiencing, and when done right, it’s the printed piece that helps marketers boost response rates.
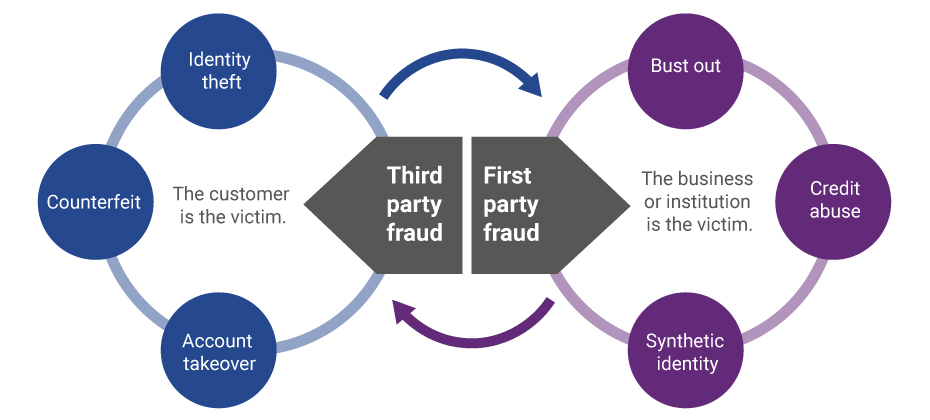
Evolution of first-party fraud to third Third-party and first-party schemes are now interchangeable, and traditional fraud detection practices are less effective in fighting these evolving fraud types. Fighting this shifting problem is a challenge, but it isn’t impossible. To start, incorporate new and more robust data into your identity verification program and provide consistent fraud classification and tagging. Learn more>