
All posts by Gary.Stockton@experian.com

Small business lending is evolving. Experian uncovers who's being left out and where the biggest commercial credit opportunities are hiding.

Leisure & Hospitality in 2026: Reading the Risk Signals Behind Strong Demand
Commercial Pulse ReportDiscover key Leisure & Hospitality trends, including 181% growth in credit inquiries, record travel demand, and insights for risk leaders.

First-Party Fraud Is Rising Again: What Commercial Lenders Should Be Watching Now
Commercial Pulse ReportFirst-party fraud is rising across commercial lending. Learn how fraud trends, AI, and dark web activity are reshaping fraud risk management.

The Experian Small Business Index gained 3 points in April, driven by strong business formation, increased business credit demand.

Watch the recording of the Small Business Economic Review webinar where Experian shared and discussed critical insights from the latest Main Street Report. This exclusive quarterly webinar delivers data-driven insights into small business credit performance, lending trends, and the forces shaping the U.S. economy. Whether you’re a lender, credit manager, or business strategist, this session will help you make informed, confident decisions heading into 2026. Why You Should Watch Leading Experts on Commercial and Macro-Economic Trends Credit insights and trends on 30+ Million active businesses Industry Hot Topics Covered (Inclusive of Business Owner and Small Business Data) Commercial Insights you cannot get anywhere else Peer Insights with Interactive Polls (Participate) Discover and understand small business trends to make informed decisions Actionable takeaways based on recent credit performance In an uncertain economic climate, information is your greatest advantage. The Experian Small Business Economic Review gives you the data, context, and expert perspective you need to navigate what’s next with confidence. 📅 Want to be alerted for our next webinar? Subscribe to our Commercial Insights Hub
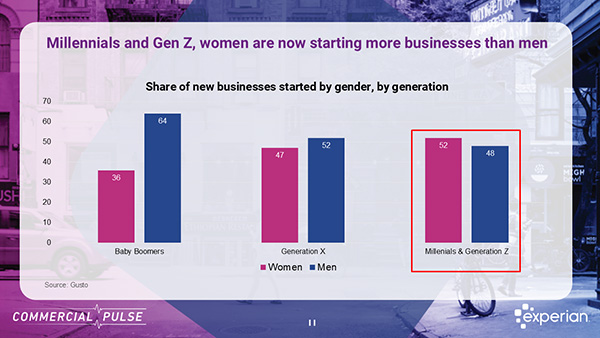
Understand the credit dynamics of women-owned small businesses and their critical role in the growth of the U.S. economy.
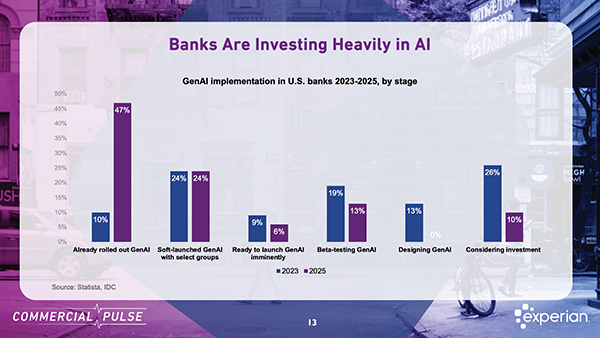
Banking transformation is accelerating through consolidation, digital adoption, and AI innovation. What must CROs prepare for next?
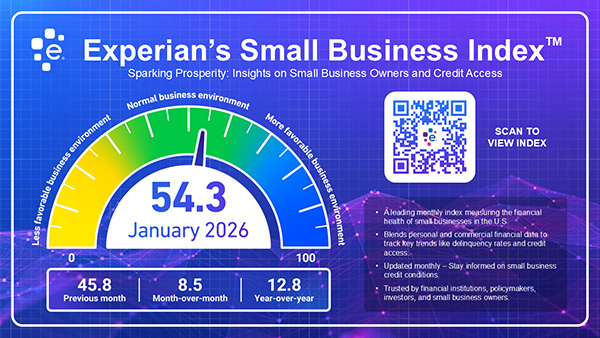
The Experian Small Business Index™ increased 8.5 points to 54.3 in January. This is 12.8 points higher than it was a year ago.
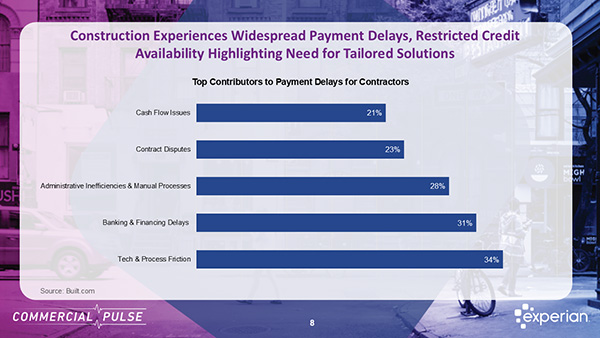
Experian's Construction Industry Risk Model Offers Greater Precision for CRO's Construction is building momentum in 2026 — but capital is becoming more selective just as demand accelerates. For Chief Risk Officers, this is not simply a growth story. It is a risk calibration moment. For Chief Risk Officers and commercial lenders, that combination creates a complex credit environment: expanding opportunity on one hand, rising sector-specific risk on the other. This week’s Commercial Pulse Report highlights why construction deserves close attention — and why traditional risk tools may not be sufficient in the current cycle. Watch The Commercial Pulse Update A Growing Sector with Structural Tailwinds Construction contributes approximately 4.8% of U.S. GDP and remains a foundational industry supporting infrastructure modernization, AI-powered data centers, renewable energy expansion, and multifamily housing demand. Since Q1 2013, the number of construction firms in the U.S. has grown by 28%, reaching nearly 950,000 establishments. Employment in the sector has increased 49% since January 2010, reflecting both demand expansion and increased new business formation. Construction spend peaked at just over $2.2 trillion in April 2024, contracted 3.3% in 2025, and is forecast to rebound 7% in 2026 to exceed $2.1 trillion. Construction businesses seek credit more than twice as often as companies in many other industries — a structural dynamic that fundamentally alters how risk signals should be interpreted. From a growth perspective, the fundamentals remain solid. Non-residential construction is particularly strong, driven by: AI-powered data center buildouts Renewable energy infrastructure Public infrastructure modernization Regional population and job growth For lenders, that growth trajectory signals continued credit demand — especially for working capital, equipment financing, and project-based lending. But growth alone doesn’t define risk. Payment Friction Is Structurally Embedded While construction is expanding, it is also experiencing persistent cash flow strain. According to a 2025 industry study referenced in the report: 70% of contractors regularly face delayed payments 41% have increased their use of credit to manage cash flow 1 in 4 contractors have reduced bidding activity due to financial strain Top contributors to payment delays include: Cash flow constraints Contract disputes Administrative inefficiencies Banking and financing delays Technology and process friction Construction projects are capital-intensive and milestone-driven — meaning liquidity depends on payment timing, not just performance. When developers delay payments, the effects cascade through subcontractors and suppliers. For lenders, this creates a recurring risk pattern: strong backlog with fragile cash flow. For CROs, this creates a distinct risk profile: businesses may show strong top-line growth but experience liquidity stress due to payment timing — increasing reliance on revolving credit and short-term financing. Construction Businesses Seek and Use More Credit Experian data reveals that construction businesses: Seek commercial credit more than twice as often as non-construction businesses Maintain a higher average number of commercial trades Exhibit higher 60+ day delinquency rates compared to other industries At the same time, commercial lenders continue reporting tightened underwriting standards, particularly for small firms. This dynamic — structurally elevated credit demand colliding with tighter credit conditions — increases the need for precise risk interpretation. Elevated inquiries and higher trade counts in construction are not inherently distress signals. In many cases, they reflect the capital-intensive, project-based nature of the industry. The risk is not high credit usage — the risk is misinterpreting what that usage signals. Construction firms are not homogenous. Risk varies significantly across: Trade specialty Project mix (residential vs. non-residential) Business maturity Regional economic exposure Capital structure and utilization patterns Generic commercial risk scores may not fully capture these industry-specific nuances, increasing the potential for both over- and under-estimating risk within construction portfolios. Why Generic Risk Models Fall Short in Construction Construction presents several characteristics that can distort traditional risk assessments: High inquiry and trade activity – Elevated credit usage may reflect normal operating structure, not necessarily distress. Cyclical delinquency patterns – Project-based payment timing can temporarily inflate delinquency metrics. Industry-specific trade relationships – Supplier networks and payment practices differ from other sectors. Material cost volatility – Construction input costs have tripled since the early 1980s and remain elevated relative to pre-pandemic levels. When underwriting models are calibrated to all industries collectively, they may under- or over-estimate risk within construction portfolios. In tightening credit cycles, imprecision compounds faster: Constraining high-quality borrowers Underpricing volatile segments Misallocating capital For CROs, this is not theoretical — it is a margin issue. The Case for Industry-Specific Risk Modeling Addressing this requires industry-calibrated analytics — models built specifically to reflect construction trade behavior and payment dynamics. For example, Experian developed the Small Business Credit ShareTM model for Construction — a purpose-built commercial risk score tailored specifically to businesses with construction trades. The model: Uses advanced machine learning methodology (XGBoost) Predicts the likelihood of becoming 61+ days beyond terms within 12 months Incorporates aggregate business data, public records, trade data, and construction-specific attributes Produces a score range of 300 to 850, where higher scores indicate lower risk Performance testing shows improved KS and GINI separation compared to generic all-industry models, as well as stronger bad capture rates in the lowest scoring deciles. In practical terms, that means: Better identification of high-risk borrowers Improved differentiation among mid-tier applicants More confident credit line sizing Smarter portfolio monitoring For lenders balancing growth objectives with capital discipline, industry-optimized analytics can materially improve decision accuracy. Learn More about Experian SBCS Construction Score Strategic Implications for Chief Risk Officers As we move further into 2026, construction presents a paradox: - Strong sector growth - Elevated credit demand - Tightening lending standards - Persistent payment delays - Increased reliance on alternative capital The strategic question for CROs is not whether to participate in construction lending — it is how to do so with precision. Key considerations include: Are your underwriting models calibrated to sector-specific risk patterns? Are you distinguishing between structural credit usage and distress signals? Are portfolio limits aligned to trade-level risk differentiation? Are you leveraging machine learning where appropriate to isolate “bads” earlier? In a tighter credit market, competitive advantage often comes from accuracy — not volume. Growth Requires Discipline Construction will remain a critical growth engine for the U.S. economy in 2026. Demand is real. Infrastructure investment is accelerating. Capital needs are expanding. But so are constraints. For lenders and risk leaders, the opportunity lies in balancing participation with discipline — using analytics sophisticated enough to separate resilient operators from liquidity-stressed borrowers. The cranes are rising.Capital is tightening. In 2026, growth will be available. Precision will be decisive. Learn more ✔ Visit our Commercial Insights Hub for in-depth reports and expert analysis. ✔ Subscribe to our YouTube channel for regular updates on small business trends. ✔ Connect with your Experian account team to explore how data-driven insights can help your business grow. Download the Commercial Pulse Report Visit Commercial Insights Hub