Data Snapshot: VantageScore 4.0 Adoption Trends

Updated: November 20, 2026 by Angad Paintal 3 min read November 20, 2026


Recent data indicate early signs of increased VantageScore 4.0 adoption among certain market participants.

For example, recent Experian Capital Markets data reporting points to gradual growth in VantageScore 4.0 adoption, with the number of lenders delivering loans scored using VantageScore 4.0 to Fannie Mae and Freddie Mac increasing from about two to about six, and VantageScore 4.0 loans beginning to appear in a larger share of GSE pools.

Adoption is still early, though. A pool may contain a VantageScore 4.0-scored loan without other VantageScore 4.0 loans making up a significant portion of its balance.
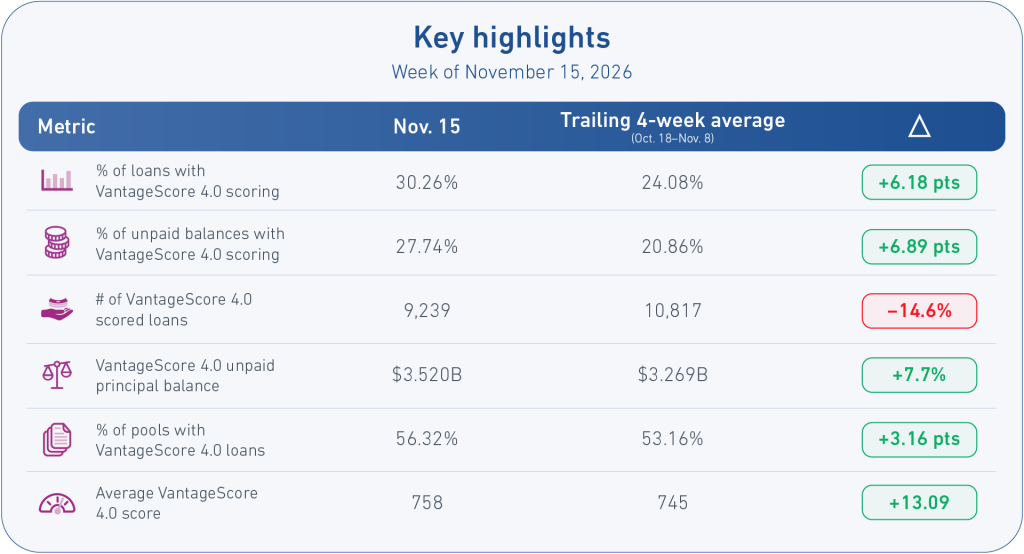
Key takeaways:

  • Within the data analyzed, adoption share of the VantageScore 4.0 reached its highest observed level during the reporting period.
  • Volume rebounded withVantageScore 4.0 loans nearly doubling week over week (up from 4,692 to 9,239) and VantageScore 4.0 unpaid balances tripling from $1.18B to $3.52B.
  • The average VantageScore 4.0 score rose to 758, up 17 points from Nov. 8 (741) and the highest since at least early October.
  • Pricing on VantageScore 4.0 loans is still small. During the week of Nov. 15, 13.6% of loans were priced with VantageScore 4.0, up from 8.6% on Nov. 8 and 7.6% on Nov. 1. Meaning that about 30% of loans carry a VantageScore 4.0 score but only about 14% were priced on it.

Lenders are also testing different ways to use the score. In certain scenarios, published GSE pricing frameworks may result in lower LLPA assessments for some borrowers, although outcomes will vary based on individual loan characteristics. The data may also be consistent with lenders evaluating whether VantageScore 4.0 identifies additional borrowers compared with alternative scoring approaches, including for cash-out refinances. Looking at both pieces together, the data suggest adoption is expanding, while lenders refine their origination strategies in light of a flat LLPA grid and availability of two scoring models.

Rapid rise in originators

There are now 199 distinct originatorsthat have at least one loan with a valid VantageScore 4.0 value delivered to the GSEs—but this count includes a long tail of lenders with just one to two loans.
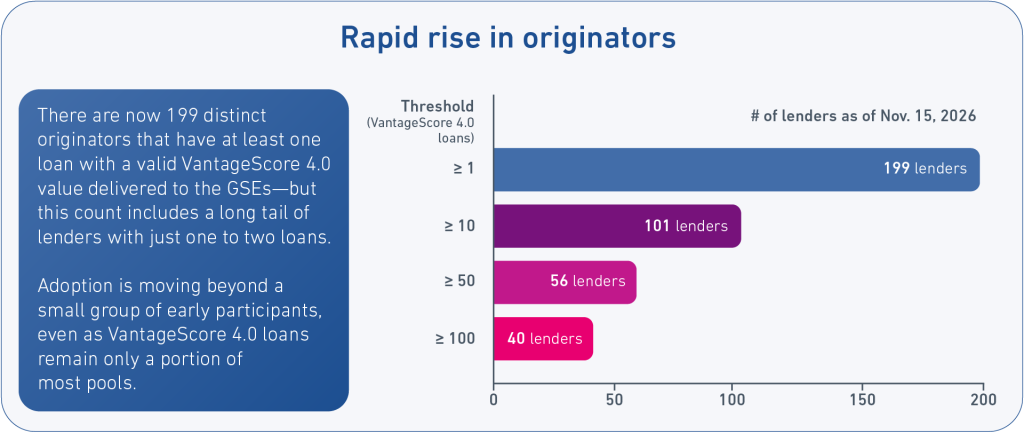
Adoption is moving beyond a small group of early participants, even asVantageScore 4.0loans remain only a portion of most pools.

What to look out for

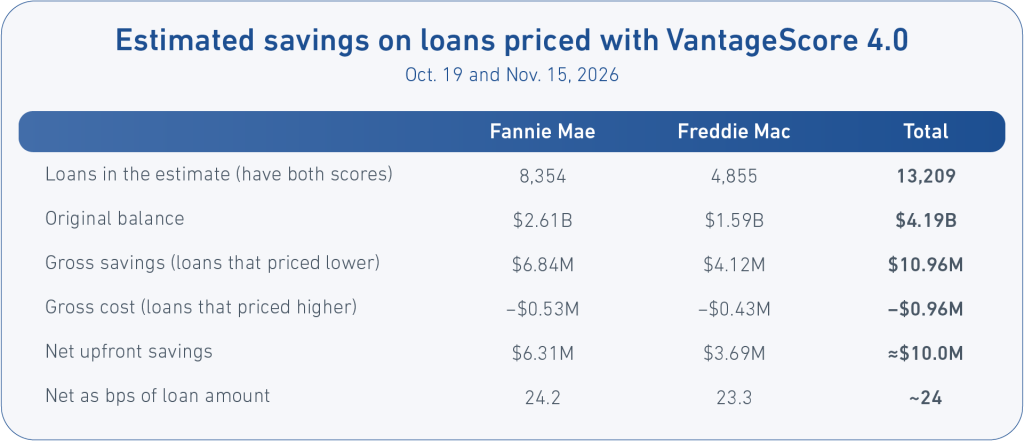
Based on our analysis of GSE disclosure data from loans delivered after Oct. 19, and certain assumptions regarding applicable LLPA grids, we estimate that loans priced using VantageScore 4.0 during the period may have generated approximately $10 million in aggregate borrower fee savings. Actual borrower outcomes may vary.
Disclaimer

The observations in this article are based on publicly available GSE disclosure data and Experian analysis. Estimates are subject to the limitations of the underlying data and the assumptions used in our methodology. The analysis should not be interpreted as evidence of lender strategy, underwriting intent, borrower qualification outcomes, or realized consumer savings. Individual lender practices and borrower outcomes may vary.

Learn more about Experian’s Capital Markets offerings and get in touch with us here.

Related Posts

How GenAI Fraud Bots Fly Under the Radar (and How to Ground Them Before It’s Too Late)

Today’s AI-powered fraud bots are exceptionally good at mimicking human behavior. Learn why a modern defense strategy is key.

November 18, 2026 by Laura Burrows
What Is Incident Response? Key Steps, Planning and Best Practices

Learn what incident response is, the key steps in the process and how to build and test an incident response plan for a data breach.

November 17, 2026 by Laura Burrows
Rethinking Charged-Off Portfolio Prioritization

Experian’s new Recovery Scores model turns portfolio intelligence into more focused recovery strategies, helping organizations improve returns, direct effort and accelerate speed to cash. The challenge isn’t simply working more accounts. Whether a debt buyer is evaluating an acquisition, an agency is deciding where to assign collector time or a lender is managing its own post-charge-off accounts, the question is similar: How can limited capacity be directed toward accounts with the greatest potential for recovery? Prioritizing accounts mainly by age, balance or when they were last worked may not show which ones are most likely to generate a recovery. With the new Recovery Scores model, organizations can rank charged-off accounts by expected collectability, providing a consistent signal to inform placement strategy and treatment decisions across the recovery lifecycle. Make collector capacity a strategic resource Working every account with the same level of attention isn’t always practical. The more useful question is: Where should teams focus first to protect speed to cash? Our model performance analysis found: 80% of recovered dollars come from the top 40% of accounts worked. The value isn’t simply a better ranking. It’s how organizations can use it for collections optimization. Score bands can inform different strategies for placement, outsourcing, auction and legal channel treatment rather than applying the same approach across an entire portfolio. For debt buyers: The scores can inform acquisition pricing and how a newly purchased portfolio is divided across internal collections, legal channels and resale. Expected collectability can shape debt portfolio analysis, including how a portfolio is valued and segmented before collection work begins. For agencies: Score bands can help teams focus collector resources on accounts with stronger recovery potential. For first-party lenders: Managing recovery internally, the scores provide another signal to help structure decisions about which accounts to work and in what order. Look beyond collectability alone Prioritization rarely comes down to a single variable. Consider two accounts that both rank highly for expected collectability, but one has a substantially larger balance. Their recovery likelihood may be similar, but the potential dollars recovered are not. The Recovery Scores model uses debt collections analytics by combining Experian’s bureau-based score with current balance information. This helps organizations consider both the likelihood of recovery and the potential dollars at stake, while sensitive balance information remains within the organization’s working environment. Monitor accounts as they change The first decision about an account is rarely the last. Teams continually make choices about treatment, placement and resource allocation as accounts move through the recovery process. Recovery Scores is also available as a trigger. When underlying information changes, teams can receive an update and reconsider an account’s placement without waiting for the next portfolio-wide re-score. An account that shows lower recovery potential today may have a different recovery outlook later. Turn recovery potential into a portfolio strategy When portfolios contain more accounts than teams can work at once, the question isn’t simply, “How many accounts can we work?” It is, “Where can our resources have the greatest impact?” The latest Recovery Scores model helps organizations sharpen placement and treatment decisions. It gives debt buyers a way to price and segment portfolios with greater confidence and gives lenders another tool to direct limited collector time across their own post-charge-off portfolios. Learn more about Experian Recovery Scores

November 10, 2026 by Zohreen Ismail

Subscribe to our Newsletter

Enter your name and email for the latest updates.

This site is protected by reCAPTCHA and the Google Privacy Policy and Terms of Service apply.

Subscribe to our Newsletter

Don't miss out on the latest industry trends and insights!
Subscribe