Data and Analytics
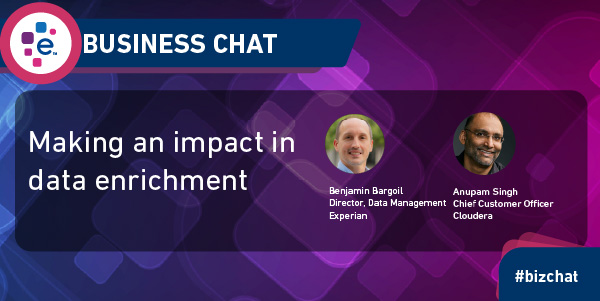
In this Business Chat, we speak with Ben Bargoil and Cloudera's Chief Customer Officer, Anupam Singh to talk about data enrichment and making an impact.
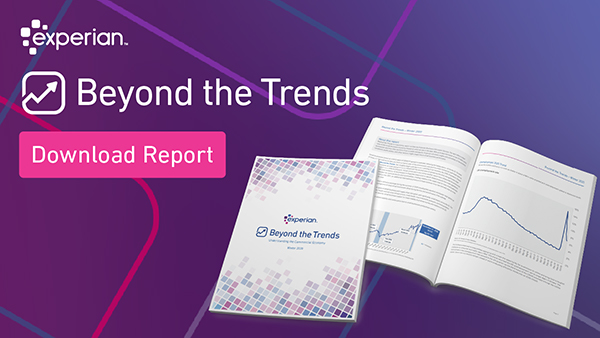
The Experian Beyond the Trends report takes a closer look at challenges pertinent to small businesses. The Winter 2021 edition is available now for download

In this post Experian demonstrates the predictive power of blended credit scores.

Credit risk scores predict credit risk in the near future, based on the credit profile as of today. We explain how to perform a model validation on a score.
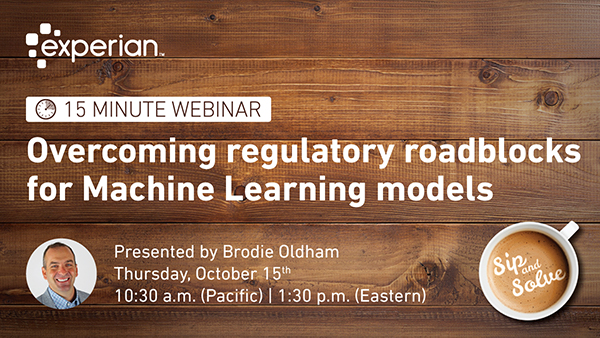
We discuss model governance basics, how machine learning methods are boosting performance, and best practices in deployment and documentation.
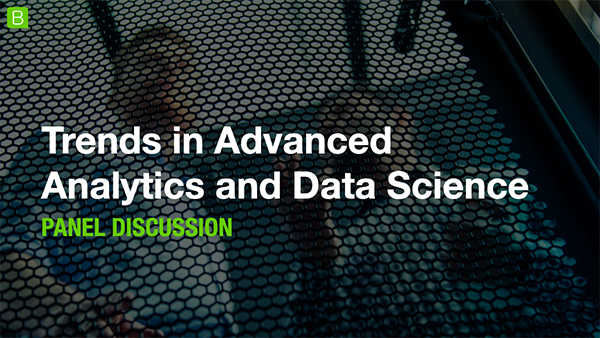
Matt Shubert, Experian's Director of Data Science and Modeling participated in a discussion about trends in AI and Machine Learning. He shared insights on how Experian Business Information Services is leveraging these technologies for clients. Matt and a panel of industry experts discuss how businesses are taking advantage of predictive analytics technology to gain a competitive edge in the marketplace. Webinar Highlights: - Use cases that show how AI and machine learning are helping companies be more proactive than ever - How predictive modeling can lead to more informed business decisions - What steps organizations can take to adopt an AI-enhanced analytics strategy that works for them - And more! Panelists: Puravee Bhattacharya, Senior Data Scientist and Analytics, BI & Performance Reporting at Energia Nirupam Srivastava, Vice President - Strategy and AI at Hero Enterprise Matt Shubert, Director of Data Science and Modeling at Experian

Experian announces Ascend Commercial Suite to help business lenders and insurance carriers mitigate risk and drive growth
Data and AnalyticsExperian announces Ascend Commercial Suite to help business lenders and insurance carriers mitigate risk and drive growth
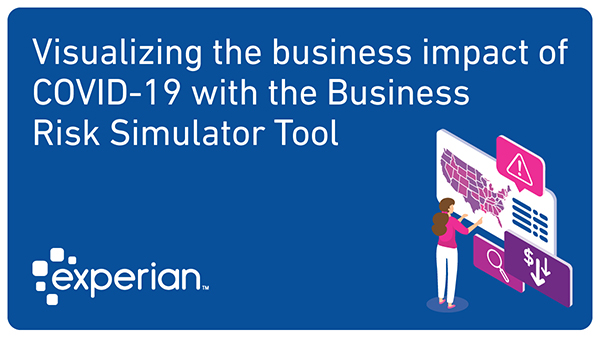
In just a few days Experian built a robust simulator tool which helps businesses assess the impact of COVID-19 as the disease spreads.
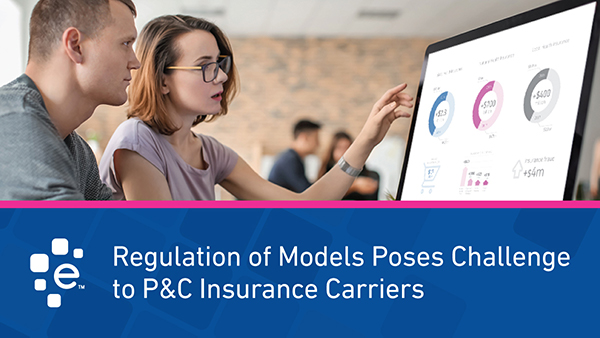
Third-party analytics and data companies working with property and casualty insurance carriers are introducing sophisticated risk modeling techniques, but there are often regulatory complexities to consider.