Credit risk scores predict credit risk in the near future, based on the credit profile of the business as of today. So you have a new applicant. What do you do? You get that credit risk score for those applicants with a great score; you’re going to approve them and hope they’ll be good customers for life. For those applicants with a high-risk score, you may have to decline them.
This is the way it’s supposed to work, but how do you know if the risk score works for your portfolio? What is the risk associated with the score specifically for you? To understand the risk of the score for your applicants, you can start scoring all new applicants as of today and wait 3, 6, 12 months. But who has the time to wait a year to see if the score predicts good versus bad outcomes accurately?
Watch our Fast FUNdamentals Video
A more immediate way is to score the newly booked accounts from a year ago and compare the score at application with the performance up to today. This process is called model validation. It’s possible because Experian archives a snapshot of all business credit profiles and scores monthly going back more than a decade. Model validation results are represented through a performance table or odds chart. Let’s go over a simple model validation odds chart.
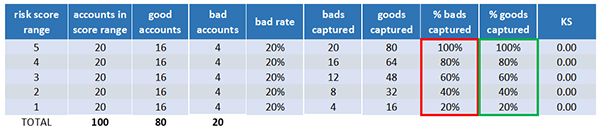
The risk score is scaled from 1 to 5, with 5 indicating the lowest risk and 1 indicating the highest risk. Younger businesses, businesses with minimal credit experience, or companies with severe delinquencies or collections would score low.
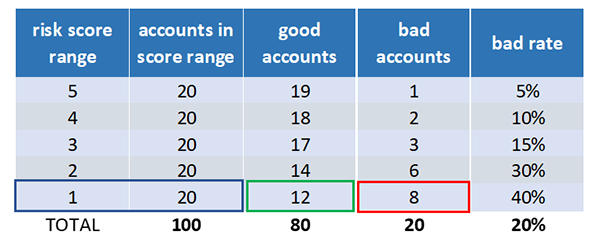
This table shows the number of accounts that got each risk score. These columns show the number of accounts that say good or went bad within the first 12 months of account opening at the point of application. This is the bad rate for each score by knowing what the risk of the score is for your portfolio. You can understand the risk of new applicants going forward.
A common metric used to determine a risk score’s predictive power is KS named for its craters, Kolmogorof and Smirnoff. KS measures a score’s ability to separate two populations. In this case, future goods and future bads. If more bads get lower scores and more goods get high scores, then the model is doing an excellent job of predicting credit risk.
Let’s quantify how good the model is performing by calculating KS. We see that 20 accounts got the worst score – a 1, and 12 of these accounts stayed good within one year of opening, and eight of these accounts went bad within one year of opening.
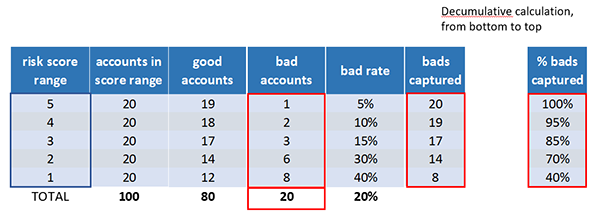
Now let’s add some columns that calculate values from the worst score on up. These are called the cumulative calculations. At the worst score of 1 there are eight bads captured out of 20 total bads, which is 40% of all bad accounts. At the score of 1 to 2 there are 14 bads captured out of 20 total bads, which is 70% of all bad accounts. At the score of 1 to 3 there are 17 bads captured out of 20 total beds, which is 85% of all bad accounts. Finally, at score of 1 to 5, there are 20 bads captured out of 20 total bads, which is 100% of all bad accounts.
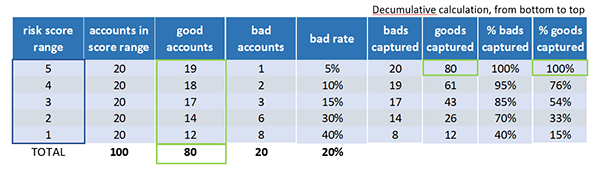
We go through the same calculations for the percentage of good captured.
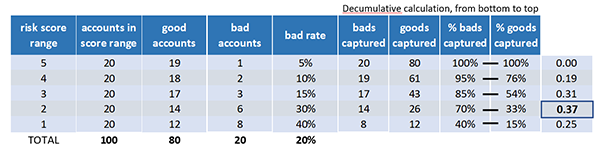
Let’s calculate that KS now. At each score range, we subtract the percentage of goods captured from the percentage of bads captured. The KS is just the maximum difference between the percentage of bads captured and the percentage of goods captured. The KS is scaled from 0 to 100 with 0 indicating no ability to predict good versus bad outcomes, and 100 indicating perfect prediction. Let’s see a model that can not predict credit risk at all.
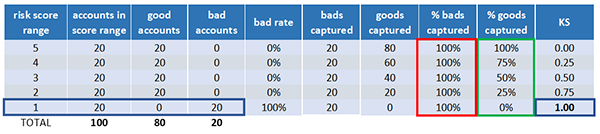
This model captures the same percentage of goods and bads at each score. So the maximum KS is zero. Now let’s see how a model can get to a KS of 100.
There it is, all bads got the worst score of 1 and no goods.
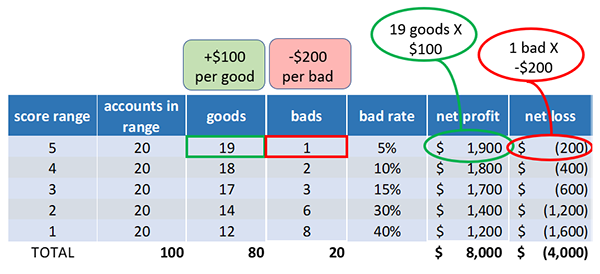
All right, now that we understand how well the risk score predicts risk, let’s discuss how we can apply your odds charts, make data-driven decisions. Let’s say on average, you make $100 dollars on every excellent account, but you lose $200 for every bad. For each score we calculate the net profit by multiplying the number of goods by profit per good. Net loss by multiplying the number of bads by loss per bed. Now let’s calculate the cumulative net profit and loss from best to worst score. We’re simply summing the net profit and net loss amount as we go from a score of 5 down to 1.
Lastly, we subtract the cumulative net loss from net profit at each score to determine the score cut. To maximize profit for all the accounts that score a 5, we’re making a profit of $1,700. As we add lower-scoring accounts, our maximum profit continues to increase. When we add the accounts at score 1, the maximum profit decreases by $400.
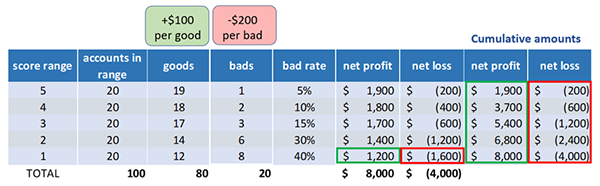
This means that we maximize profit by approving everyone that scores 2 and higher. For those that score 1, there are 20 accounts, and we’re losing $400 from them. We can choose to decline them or charge them a deposit of $20 or more to be profitable because we’re losing $20 on average per account here.