A Deeper View into Residential Mortgage Prepayments: Mobility, Sources of Payoff Funds, and Market Re-entry

by Perry DeFelice 4 min read October 2, 2025

financial management services

Since mortgage rates have remained high even after recent Federal Reserve rate-cutting activity, there is limited rate incentive to refinance for the vast majority of borrowers. In the absence of significant rate incentive, borrower mobility and behavioral tendencies have become outsized drivers of both prepayment speeds and origination volumes.

Unfortunately, traditional MBS market data does not contain adequate information for investors to analyze either borrower mobility or behavioral tendencies like sources of payoff funds (i.e., cash payoff, refinance of existing loan, opening of a new lien on a 2nd home, etc.). 

By using Experian’s Mortgage Loan Performance (MLP) Dataset, a monthly-updated time series featuring combined loan, borrower, and property-level details covering nearly the entire US mortgage market since 2005, it’s possible to examine patterns in behavior for borrowers who have prepaid their loans early, such as:

  • The proportion of paid-off borrowers who retain the subject property (“stayers”) versus those who move (“movers”); and for both of these subsets, the percentage of people who re-enter the mortgage market with a new loan (“returners”) compared to those who leave the mortgage market after paying off their loan (“leavers”). Classification as returner or leaver in the charts below is based on whether the paid-off borrower opened a new mortgage loan as of the end-of-August observation date.
  • Sources of mortgage payoff funds — what proportion of pay-off was via refinance of the subject property vs. opening a new lien on a 2nd home or investment property?  What proportion pays off in cash resultant from a sale of the subject property or cash out-of-pocket while retaining the subject property?
  • For the set of returners, what is the typical time lapse between payoff and opening of a new mortgage, i.e., are most payoffs simultaneous or are a significant number of borrowers utilizing bridge financing, or paying off a current loan while they shop for a new home and new loan?
  • For the set of leavers, what are the credit, income and demographic characteristics of these borrowers?  Are they leaving the mortgage market because they are unable to get a new loan due to weak credit or insufficient income?

Mobility and source of payoff cash dynamics are summarized below for a sample of ~ 63,000 mortgage payoff events, drawn from MLP, which occurred from February to July 2025.


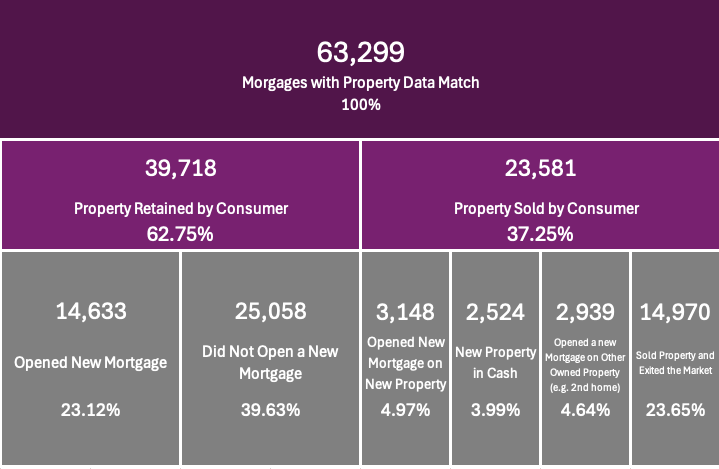
Amongst other trends, we see that approximately 70% of borrowers who paid off their loan exited the mortgage market (~40% retained property after a cash payoff + ~4% sold property and bought a new property in cash + ~24% sold property and didn’t purchase another property).  This high proportion is probably driven in part by the relative lack of rate/term refinance and purchase activity given the current rate environment.

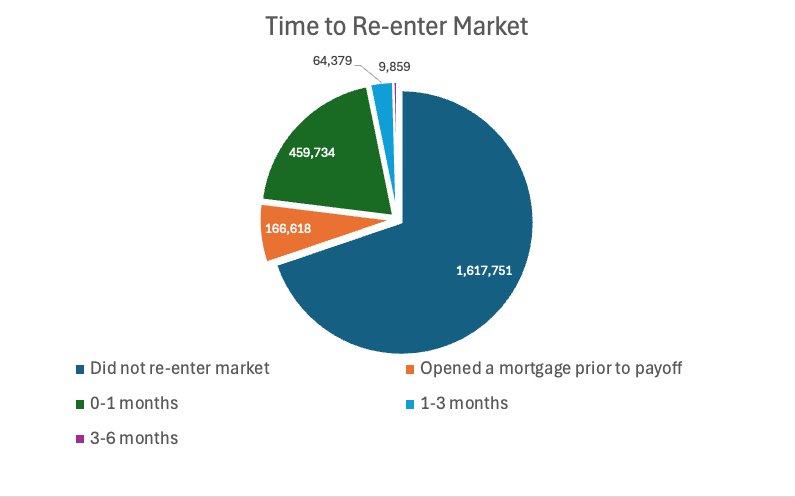
When we look at all payoffs in MLP over the same time period — 2.3 million payoff events — the ~70% proportion of leavers holds. Within this larger sample, we also break down time to re-entry for the returners.  Unsurprisingly, of the 30% returners, the vast majority open a new loan just prior to or within a month of prepayment:

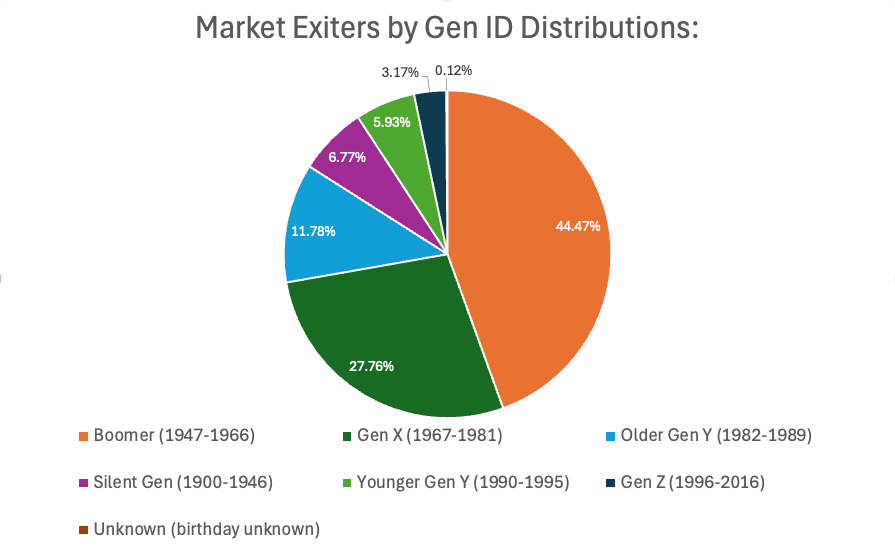
Since MLP contains monthly-refreshed, joined credit profile data for every mortgaged borrower, we can also examine the credit and income characteristics of leavers to determine if poor credit or limited income prohibited re-entry. This analysis reveals that leavers are generally not credit or income limited; the pool of leavers is characterized by the following average metrics:

  • 746 current Vantage 3.0 credit score
  • 49 years of age
  • $99,759 current modeled income
  • 34.8 back-end DTI

The following table stratifies the leaver population by generation:

Further segmentation by loan servicer, originator and borrower credit profile (e.g., dollar amount of student loan debt outstanding) and past behavior (e.g., how many mortgages has this borrower refinanced in the past?) across all tradelines are potential next steps.

As the rates environment evolves, we will monitor mobility trends, the ratio of borrowers paying off loans while moving versus those staying, and how borrowers decide to finance their prepayments.

In addition to rates, changes in HPI, unemployment and underwriting guidelines will influence these behaviors.

By leveraging new datasets like MLP which capture not only loan performance, but also regularly refreshed credit profile, behavioral trends and property details over the entire credit lifespan of a consumer and all their tradelines, investors can incorporate a 360-degree view of loan, borrower and property into their predictive analyses.


Related Posts

Ask the Expert: A Closer Look at Modern Lending with Jeff Hops and Erin Haselkorn

In this first episode of Ask the Expert, Experian's Jeff Hops, Senior Director of Data Platform and Product, and Erin Haselkorn, Senior Director of Analyst Relations, explore how broader data and new signals can help lenders better understand today’s consumers, while maintaining responsible decisioning. Lending is changing  Interest rates, regulation, embedded finance and AI are reshaping the lending landscape. Consumer behavior is evolving just as quickly. But the core job hasn’t changed. Lenders are still making decisions about people they don’t fully know, and that makes data more important than ever. "There are periods where nothing changes, and periods where it seems like everything changes. We’re in the latter … but the core premise hasn’t changed. You’re still trying to lend to somebody you don’t know."Jeff Hops, Senior Director of Data Platform and Product To make those decisions with confidence, lenders need a strong foundation of identity, history and reliable signals. In a period of rapid change, the quality and completeness of that data become even more critical. A more complex view of today’s consumer What has changed is the consumer. Traditional credit data is foundational but can be further enhanced with visibility on how people earn, manage and move money. Income may come from multiple sources, and financial activity often spans bank accounts, applications (apps) and digital channels. Cash flow data, for example, can provide a clearer view of what’s actually coming into a consumer’s account, beyond what traditional records may show.These additional signals can help lenders better understand: Income variability across multiple earning sources Current financial behavior through cash flow activity Digital and identity-linked activity across channels These signals don’t replace traditional data; they expand it. The result is a more complete and current view of the consumer. From exploration to real-world application The conversation around broader data signals has moved beyond theory. Lenders are no longer just asking whether these signals are useful. They’re asking where, how and under what governance they can be applied across the lending lifecycle. Lenders are actively researching, testing and implementing new data sources across the lending lifecycle. What was once experimental is now operational. Institutions are progressing through a clear path: Research Understanding available signals and use cases Testing Evaluating performance in controlled environments Implementation Applying insights in production Today, alternative data is being used in areas like analytics, channel scoring and decisioning, often within governed environments that allow for safe testing and validation. AI may accelerate this shift by helping institutions identify patterns at scale, but its value depends on the strength of the underlying data: quality, governance, context and clear business use cases. More signal, more responsibility As data availability expands, lenders have access to more granular insights than ever before. That creates opportunity, but also responsibility. The institutions that lead won’t be the ones that use the most data. They’ll be the ones that know which signals to use, how to validate them and how to apply them in ways that are fair, explainable and aligned to consumer outcomes. “Institutions can unlock more granular and powerful decisions, but they have to do it responsibly.”Erin Haselkorn, Senior Director, Analyst Relations The future of lending will be shaped not just by how much data is available, but by how thoughtfully it’s applied. Keeping the consumer at the center of decisioning is essential to building trust and long-term success. Explore alternative data with us A more complete understanding of today’s consumers starts with better data. We help lenders responsibly incorporate broader data signals and advanced analytics into decisioning strategies, enhancing visibility into today’s consumers while strengthening risk assessment and expanding access to credit. Let’s work together to build more confident, more responsible lending decisions. Learn more Contact us About our experts Jeff Hops Senior Director, Data Platform and Product, Experian Jeff Hops is a Senior Director in Experian’s Financial Services and Data business with over eight years of experience driving innovation in credit and data solutions. He has led product development for Experian’s Credit Report and played a key role in launching Ascend Identity Platform™, a leading identity resolution platform. Erin Haselkorn Senior Director, Analyst Relations, Experian Erin Haselkorn is responsible for analyst relations for Experian. She has developed an understanding of key marketing trends across a broad range of verticals. Her market research around data strategy, AI, fraud, identity and data management, paired with her broad Experian product knowledge, gives her a unique understanding of business automation and data trends. Erin is a frequent spokesperson and guest blogger.

Published: June 22, 2026 by Julie Lee
How Consumer Vehicle Choices Are Shaping Automotive Loan Trends

Conversations about rising auto loan balances and higher monthly payments has often centered around increasing vehicle prices and elevated interest rates; and while those factors have undoubtedly played a role, another important piece of the puzzle is the type of vehicles consumers are choosing to purchase. According to Experian’s Automotive Consumer Trends Report: Q1 2026, consumers are continuing to opt for SUVs over other vehicle types, a trend that may be contributing to higher average loan amounts and monthly payments. SUVs accounted for 63.5% of all new retail vehicle registrations over the last 12 months, up from 62.8% a year ago. Additionally, more than 117 million SUVs were in operation across the United States in the first quarter of 2026, making up 42.2% of the market share. At the same time, traditional passenger cars continue to fall in share, coming in at 16.5%, a decrease from 18.4% last year. As consumers increasingly gravitate towards the larger vehicle segment, it reflects the ongoing desire for versatility, cargo capacity, and family-friendly functionality. Electrification’s growing role in consumer purchasing behavior Interestingly, electrified SUVs continue to gain traction, representing 27.7% of all new SUV registrations, these vehicles include battery-electric, hybrids, plug-in hybrids, and other alternative fuel types. Diving a bit deeper, the Tesla Model Y was the market share leader for new, retail electrified SUV registrations in the last 12 months, coming in at 15.8%. Rounding out the top five were Honda CR-V (9.6%), Toyota RAV4 (7.2%), Chevrolet Trax (7.2%), and Toyota Grand Highlander (3.4%). As model availability and familiarity with the electrification segment grows, the broader adoption of these vehicles are playing an increasingly important role in vehicle pricing and overall consumer demand. While average loan amounts and monthly payments are being driven by a combination of factors such as financing costs and consumer purchasing behavior, data in Q1 2026 demonstrates the continued interest in SUVs. This suggests that the industry’s shift toward larger vehicles is likely playing a meaningful role in today’s financing environment. To learn more about SUV insights, view the full Automotive Consumer Trends Report: Q1 2026 presentation.

Published: June 17, 2026 by Kirsten Von Busch
When New Data Impacts MBS Pricing: Student Loan Debt

In our previous post, we described the Current Second Lien Balance field, which is one of over 2,000 fields in the new Experian Mortgage Loan Performance (MLP) dataset. We showed that the Current Second Lien Balance field meets our three-pronged materiality standard for new data delivery: New: Provides information not available in existing datasets (i.e., orthogonal to currently available data). Material: Impacts a sizeable portion of the MBS universe. Significant: Differentiates collateral performance by a large enough margin to influence trading and risk management decisions. In this article, we discuss another field that satisfies the above criteria: Student Loan Balance.  We evaluate this field in the context of these criteria. First, however, we provide a summary of the MLP dataset and how it compares to standard GSE loan-level data available today. Standard GSE Data vs. Experian Mortgage Loan Performance (MLP) Data The MLP dataset contains thousands of fields describing mortgage performance from each borrower, loan, and property perspective, all refreshed monthly (including, amongst other things, new credit scores and refinance inquiry activity, loan performance, filed junior liens, and AVM values).  MLP differs from loan-level data provided by Freddie Mac, Fannie Mae, and Ginnie Mae, which the vast majority of market participants solely rely on, in a number of ways: Standard data provided by the GSEs and GNMA does not contain all the information necessary for accurate forecasting of mortgage prepayment and credit performance. Basic, critical fields like borrower’s current credit score and current junior liens on the property are missing. The new Mortgage Loan Performance (MLP) dataset from Experian contains borrower, loan, and property data fields covering the entire mortgage universe, including Agency, Non-Agency, and Esoteric mortgage products (CES, HELOC, Reverse), both securitized and non-securitized. MLP enables full three-dimensional (borrower + loan + property) tracking with persistent keys for borrower (before and after refinancing), loan (in securities/deals even after exit due to payoffs or buyouts, including before and after MSR sales), and property.  This enables end-to-end analysis of each borrower’s (and property’s) mortgage experience throughout their credit lifecycle. New, Material and Significant Field:  Student Loan Debt MLP contains a number of fields describing each mortgage borrower’s student debt load, including amounts in repayment, forbearance and collections; estimated interest rate, time remaining until forbearance expiration, and more. In the interest of simplicity, for this article we’ll focus on a single student loan-related field within MLP: Student Loans Balance, which is defined as the total balance on open non-deferred student trades reported in the last 3 months. Is Information Regarding Student Loans New to Markets? Standard loan-level data disclosed by the GSEs and GNMA contain no student-loan-specific fields. Theoretically, fields related to DTI at origination might capture some aspect of student loan debt. So, in the best-case scenario for an investor relying solely on standard disclosure, a DTI value as of origination is provided -- yet is never updated as the loan seasons and the borrower’s debt and income change (see more here).  But in the case of federal student loan debt attached to mortgages originated from early 2020 to late 2023, the level of detail provided by disclosure may be even more unknown due to COVID-era repayment and reporting moratoriums. The student loan repayment moratorium was a temporary federal policy that paused required payments, set interest rates to 0%, and suspended collections on most federally-held student loans. The moratorium began in March 2020, with payments resuming in October 2023, making it approximately 3.5 years in duration—the longest consumer credit payment pause in U.S. history. (Source: NCUA ) During the moratorium, student loan-related debt loads may have been understated as federal loans were in a temporary state of $0 repayment.  As an alternative to leaving student loan debt completely out of DTI calculations, an imputed payment equal to only 0.50% of the outstanding balance was often used as a placeholder for a borrower’s DTI calculation. As the Wall Street Journal recently reported, a new report from the Federal Reserve of New York shows a rise in student loan default rates by age group.  Student loan delinquencies have been broadly trending higher across all age groups.  Also, the average age of a borrower in default has risen to 40, and borrowers age 50 and older are now at a higher risk of default than younger groups. This 40 to 50-year-old age group represents prime home ownership years. Defaulted borrowers are also struggling to make other debt payments, too. The same report stated that almost 40% of past due student loan borrowers with auto loans are past due, 56% have at least one credit card past due, and 20% have a past due mortgage.  In addition to increased delinquency risk on their mortgage, borrowers with student loan debt also have fewer mortgage refinance options, as their elevated DTI may prevent qualification for a refinance, or increase the offered rate of a refinance and thereby reduce their incentive.  These dampening effects of student loan debt on mortgage CPR are clearly evident in the data, as described further below. Standard data only reports information related to the primary mortgage and does not include any details on the borrower’s other debts, with the exception of DTI at origination, which is never updated throughout the life of the loan. In contrast, MLP provides a comprehensive view of the borrower’s full credit profile, including other obligations such as credit cards, mortgages on other properties, student loan balances, and much more. Is Student Loan debt material to the residential mortgage market? Approximately $11 trillion of residential mortgage loans were originated during the student loan payment moratorium (Source: Experian MLP Dataset), a period marked by historically low mortgage rates during the COVID era.  As discussed above, DTI data contained in standard market disclosure may be particularly inaccurate for these loans.   As the Wall Street Journal recently reported, a new report from the Federal Reserve of New York shows a rise in student loan default rates by age group.  Student loan delinquencies have been broadly trending higher across all age groups.  Also, the average age of a borrower in default has risen to 40, and borrowers aged 50 and older are now at a higher risk of default than younger groups. This 40 to 50-year-old age group represents prime home ownership years.  Defaulted borrowers are also struggling to make other debt payments, too.   The same report stated that almost 40% of past due student loan borrowers with auto loans are past due, 56% have at least one credit card past due, and 20% have a past due mortgage.  In addition to increased delinquency risk on their mortgage, borrowers with student loan debt also have fewer mortgage refinance options, as their elevated DTI may prevent qualification for a refinance, or increase the offered rate of a refinance and thereby reduce their incentive.  These dampening effects of student loan debt on mortgage CPR are clearly evident in the data, as described further below.  Of today’s $13 trillion in outstanding mortgage debt, more than 10% of that debt ($1.5 trillion) is associated with borrowers who carry student loan debt.  For these borrowers, the average amount of student loan debt outstanding is approximately $50,000, versus a mortgage balance of approximately ~$289,000. In other words, the average student loan debt balance is almost 20% of the mortgage balance for the average borrower who carries both. For this set of borrowers, the average monthly payment is approximately $400 for student loan vs. approximately $2,200 for 1st lien mortgage—so that monthly student loan payments are a significant debt load, approximately 20% of the monthly mortgage payment.  (Source:  Experian MLP Dataset)  Is the effect of student loan debt a significant driver of performance? Figure 1 illustrates prepayments by student loan balance for a sample of loans drawn from MLP. The chart illustrates that borrowers with larger student loan balances prepay much more slowly, likely because some are effectively locked out of refinancing once student loan payments resume due to elevated DTI. The debt-to-income (DTI) ratio calculated using actual student loan payments may be significantly higher than the DTI calculated during the moratorium, in some cases exceeding GSE eligibility thresholds. As illustrated in Figure 1, for in-the-money (ITM) collateral, the differential between loans with material student loan balances (greater than $200,000) and loans with no student debt can reach up to 5 CPR. Notably, even for out-of-the-money (OTM) collateral, loans with student debt prepay 1 to 3 CPR slower, likely reflecting reduced mobility due to tighter financing constraints when purchasing a new home. Pools with otherwise similar prepayment characteristics may exhibit different prepayment behavior depending on the distribution of student loan exposure within their collateral. In addition, because loans with student debt tend to prepay more slowly, this effect increases over time due to burnout: loans without student debt prepay and exit the pools more quickly, leaving a higher concentration of slower-paying loans behind.  Given that 10% of the $13 trillion outstanding mortgage market is associated with borrowers who have student loans (Source:  Experian MLP dataset)—and that student loans have a meaningful impact on prepayments—many pools issued between March 2020 and October 2023 may be subject to this student loan debt CPR throttle, and therefore mispriced by investors relying exclusively on standard market data. Fig 1. Prepayment S-Curve: Student Loans Balance Source:  Experian MLP dataset hosted on IVolatility Data-Driven Platform _____________________________________________________ Michael Pyatski advises MBS traders, portfolio managers, quants, risk managers, loan originators, and technology professionals on making informed, data-driven business decisions that drive revenue growth, enhance risk management, and reduce trading costs. With more than 15 years of experience as an Agency RMBS trader—including serving as Head of the Proprietary Trading Desk at BNP Paribas—Michael developed and successfully implemented relative-value, data-driven profitable trading strategies to capture market opportunities embedded in data but not fully priced by the market. His trading experience, combined with a Ph.D. in econometrics, led him to found the Data-Driven Portal (https://datadrivenportal.com/), a platform that provides advanced technology for MBS trading and risk management. The platform’s No-Model Data-Driven technology leverages big data, econometric analysis, and AI to help traders identify relative-value opportunities in RMBS markets and generate above-market, risk-adjusted returns. _____________________________________________________

Published: June 17, 2026 by Perry DeFelice, Michael Pyatski

Request More Information

Subscribe to our Housing Blog

Enter your name and email for the latest updates.

This site is protected by reCAPTCHA and the Google Privacy Policy and Terms of Service apply.

Subscribe to the Housing Blog

Receive updates from Experian Housing
Subscribe