2016 E-commerce fraud attacks on pace to surpass 2015 totals

by Guest Contributor 4 min read September 21, 2016

e-commerce attacks

Miami ranked as an overall top city for both shipping and billing e-commerce fraud
Houston, Texas is the top ZIP Code for billing fraud and Eudora, Kansas ranked as top ZIP Code for shipping fraud

The question of whether we’re in Kansas anymore is appropriate with the latest release of Experian® fraud attack data from across the United States. Eudora, Kan., is home to the highest e-commerce billing fraud ZIP CodeTM. Accounting for 5 percent of the total billing fraud so far in 2016, the town is among the top 25 riskiest ZIPTM codes, illustrating that fraud is not confined to larger cities.

Download Experian’s bi-annual 2016 Top 100 riskiest billing ZIPTM codes rankings

Experian analyzed millions of e-commerce transactions from the first six months of 2016 to identify the latest fraud attack rates for shipping and billing locations across the United States. Fraud attack rates are calculated using bad transactions in relation to the total number of transactions. Billing fraud rates are associated with the address of the purchaser, typically the fraud victims. Shipping fraud rates are associated with the address where purchased goods are sent.

The one-year anniversary of the EMV chip technology rollout for consumers and merchants in the United States is approaching. The rollout utilizes chip technology on credit cards to protect in-store payments making it harder to counterfeit cards, and helping eliminate in-store fraud. However, the 2016 e-commerce fraud attack rates appear to be at least 15 percent higher than last year’s total. This suggests that card-not-present fraud is increasing as e-commerce fraud is often an indicator that other fraud activities have already happened — a credit card has been stolen, identity fraud has occurred or personal credentials have been compromised.

The increase in e-commerce fraud is not surprising as e-commerce sales in the U.S. during the second quarter of 2016 increased nearly 16 percent year-over-year (YoY) according to the U.S. Department of Commerce. This was the greatest YoY increase since Q3 2014. At the same time, the Federal Trade Commission stated earlier this year that credit card fraud complaints had the highest reported numbers in 10 years, with a 41 percent increase in 2015 versus 2014.

“Fraudsters continue to exploit new vulnerabilities, and perpetrate card-not-present fraud against businesses using stolen consumer identity and payment data,” said Adam Fingersh, Experian general manager and senior vice president of Fraud and Identity Solutions. “This reinforces the need for aggressive fraud prevention strategies and adoption of open technology platforms to prepare for the latest emerging cyber security threats. Fraudsters have what they need to quickly capitalize on compromised data, so businesses need to be prepared.”

According to Experian’s rankings of top 100 riskiest billing ZIP codes , e-commerce fraud attack rates for the first half of 2016 show:

  • 44% of e-commerce billing fraud came from three states among the top 100 riskiest billing fraud ZIP codes – Florida, California and New York – based on the sum of fraud attacks.
  • Florida is the top-ranked state for billing fraud, with Miami home to 12 of the riskiest ZIP codes. New York ranked second, with Brooklyn home to six of the riskiest ZIP codes.
  • Houston, Texas, (77036) has the riskiest ZIP Code for billing fraud as ranked by fraud attack rate.
  • Eudora, Kan. (66025) has the next riskiest ZIP Code for billing fraud as ranked by fraud attack rate, followed by two ZIP codes in Miami (33192 and 33166) and one in Homer, Alaska (99603).
  • 52% of e-commerce shipping fraud came from three states among the top 100 riskiest shipping fraud zip codes – Florida, New York, and California – based on the sum of attacks.
  • Florida is home to 26 of the riskiest 100 shipping fraud ZIP codes, with 17 from Miami.
  • Eudora, Kan., has the overall riskiest shipping ZIP Code (66025 as ranked by fraud attack rate.
  • The next four riskiest shipping ZIP codes as ranked by fraud attack rate are located in Miami (33195, 33192 and 33116) and Nettleton, Miss. (38858).

Many of the higher-risk ZIP codes and cities are located near a large port-of-entry city or airport, making them ideal locations for reshipping fraudulent goods. This includes Miami, Houston, New York City, and Los Angeles, perhaps allowing criminals to move stolen goods more effectively. All those cities are ranked among the riskiest cities for both measures of fraud attacks.

Download the 2016 Experian top 100 fraud attack rate ZIP Code rankings.

Related Posts

Who’s Driving What? How Fuel Loyalty and Generational Preferences are Shaping the Vehicle Market

Take a look around at any road, parking lot, or highway, and you’ll see just how diverse today’s vehicle landscape has become. Within that evolving mix, electric vehicles (EVs) have seen years of rapid growth, and while the market is seemingly entering a new phase, interest remains. So, with several vehicles and fuel types to choose from, what keeps drivers coming back to electrified vehicles? Experian Automotive’s Automotive Market Trends Report: Q2 2026 found that among EV owners who returned to the market in the last 12 months, majority (72.2%) replaced their EV with another EV, while 18.5% switched to a gasoline vehicle. Hybrid buyers also showed considerable loyalty to electrification, with 55.7% of gas-hybrid owners staying with the same fuel type when replacing their vehicle, and 32.7% swapping for a gasoline vehicle. Consumers are seemingly remaining loyal to EVs and hybrids because they are attracted to the benefits that fit their everyday lifestyle, such as lower fuel or charging costs amid the elevated gas prices. For some, it could also be tied to convenience, as drivers who have found a reliable charging routine or appreciate the efficiency of a hybrid may have little reason to switch back to a traditional gasoline vehicle. Generations are taking different paths to electrification Generational differences also influence hybrid and EV loyalty, with younger consumers generally showing greater openness to alternative fuel types. While older generations tend to have greater familiarity with traditional gasoline vehicles, hybrid and EV adoption is increasing across all age groups as these options become more accessible and mainstream. Millennials, in particular, showed the strongest inclination toward electrified vehicles. Through Q2 2026, they accounted for the highest EV share at 8.2%, compared with Gen X at 5.5%, Gen Z (4.7%), and Baby Boomers (4.7%). The difference becomes even more pronounced when hybrids are in the mix, as 23.1% of Millennial registrations were gas-electric hybrids or plug-in hybrids, versus 16.7% for Gen X, 16.8% for Gen Z, and 18.0% for Baby Boomers. For automotive professionals, these differences make understanding who is driving what, and what they may choose next, increasingly important. The future of the automotive market may be less about consumers choosing one vehicle type over the other and more about understanding the distinct patterns and preferences of each generation. As the market continues to evolve, those insights can help automotive professionals better meet consumers where they are. To learn more about vehicle market trends, view the full Automotive Market Trends Report: Q2 2026 presentation on demand.

September 24, 2026 by John Howard
New Data Available for MBS Investors: Current Credit Score 

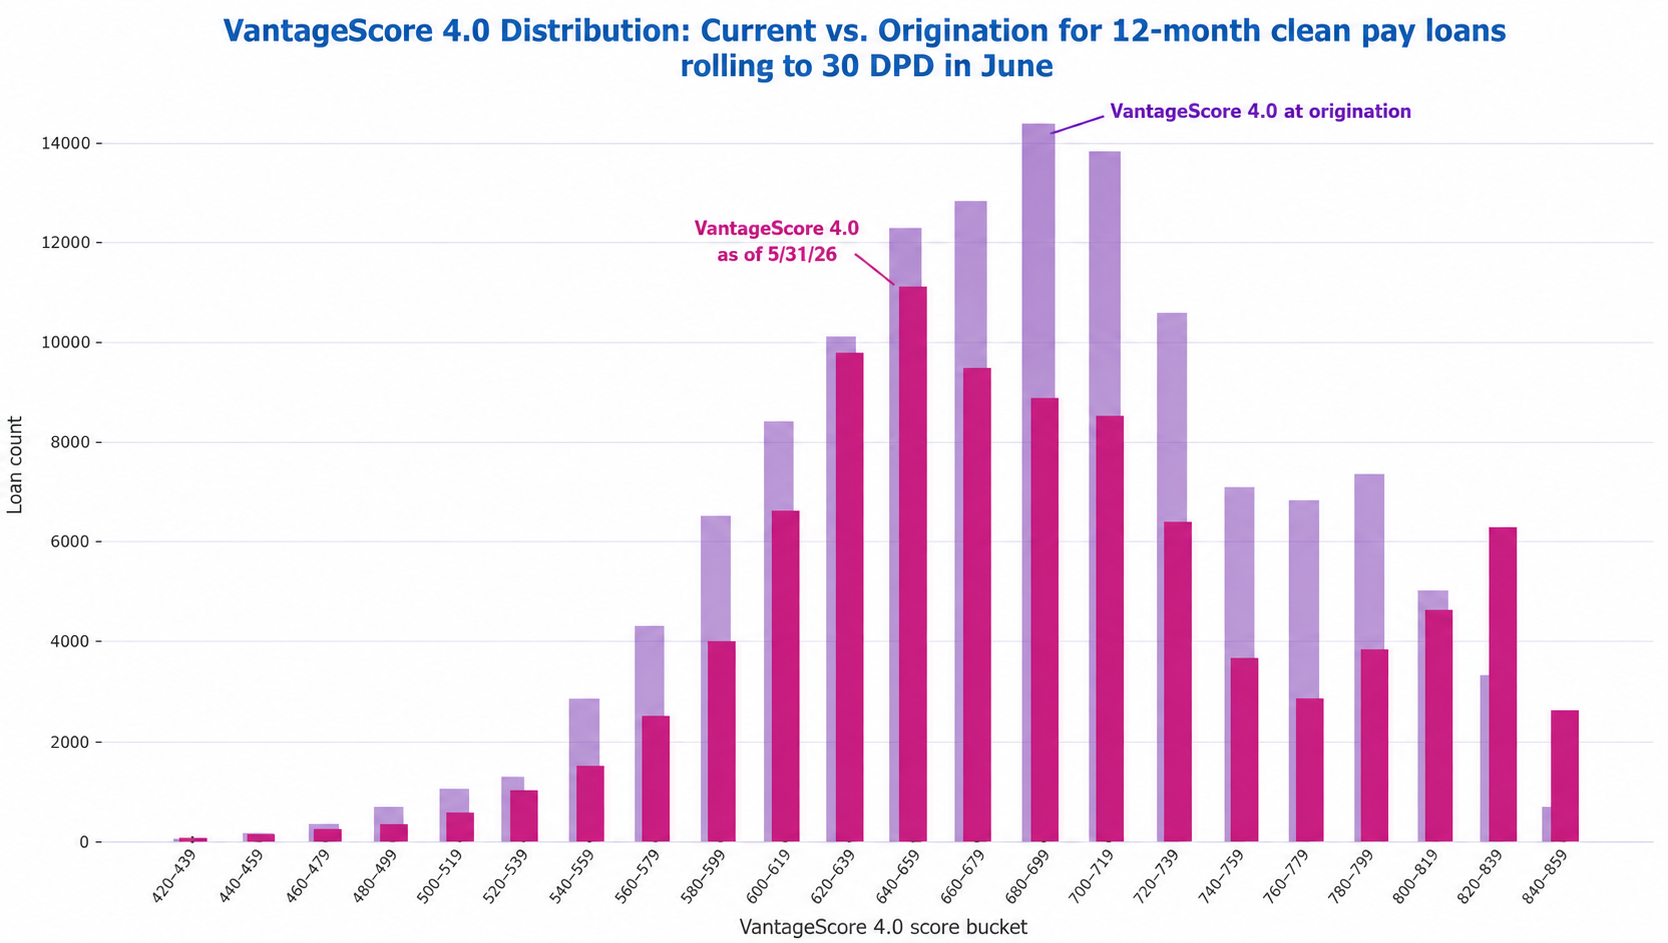
In a previous post, we described how every mortgage borrower’s financial situation and credit profile evolve over time.  After a borrower opens a loan, their financial status evolves—jobs are gained and lost; incomes can rise or fall, and financially stressful situations or windfalls can occur. These effects are often reflected in the consumer’s evolving credit score, which changes with the consumer’s payment behavior on open loans, credit inquiry activity, credit card utilization, and other revolving lines, among other things.    Even though MBS, whole loan, and MSR investors ultimately bear borrower credit risk, they may have access to less current borrower credit information than other participants in the mortgage ecosystem.   In securitized markets (both agency MBS and private-label MBS), updated scores are not provided in disclosure to bondholders, even as loans age year over year.  In whole loan and MSR markets, a single origination credit score is often provided at the time of bid, and after a successful bid, the investor may have a permissible purpose to pull individual scores on an owned portfolio. But until recently, there was no single loan-level dataset that included continuously refreshed credit scores across the U.S. mortgage market—the type of foundational dataset needed to build and tune credit and prepayment models.  A monthly-refreshed Current Credit Score field meets our three-pronged materiality standard for new data delivery to MBS markets:  New: Provides information not available in existing datasets (i.e., orthogonal to currently available data). Neither private-label MBS nor agency MBS standard market data includes a monthly-refreshed borrower credit score.  Material: Impacts a sizeable portion of the MBS universe. For the vast majority of loans in MBS, borrowers credit scores are available.  Significant: Differentiates collateral performance by a large enough margin to influence trading and risk management decisions.  A current credit score wraps all of a borrower’s credit-related behaviors into a single numerical value and has historically been associated with a borrower’s likelihood of becoming 60+ days past due on any obligation within the subsequent 24 months.    In fact, a current credit score is among the most informative indicators of near-term mortgage default risk, as shown in the image below, which depicts 30+ DPD rates by current credit score bands for the entire U.S. mortgage market, controlling for origination score <=650.    Without access to current credit scores, investors are limited to the score at origination—causing the four distinct performance trends shown here to appear as a single averaged line. In reality, score migration since origination reveals significant divergence in credit risk, with the lowest current-score bucket exhibiting a nearly 10 times higher 30+ DPD rate than the highest-score bucket in the latest period shown.  Source:  Experian Mortgage Loan Performance (MLP) dataset hosted on IVolatility DataDriven Platform  In this article, we’ll take a quick look at how score migration acts as an early predictor of a performing loan’s first roll into 30-day delinquent status.    MBS Investors’ Current Credit Score Blindspot: Solved   An MBS investor relying on standard market data and securitization remittance reports sees no sign of borrower stress until the subject mortgage loan in the securitization misses a payment and is reported at 30 days delinquent. Of course, in the vast majority of cases, a borrower begins struggling financially well before missing a mortgage payment:  The borrower may miss payments on other types of loans (credit card, auto loan, personal unsecured, or payday loans) as they prioritize their home and mortgage.  Outstanding balances on credit cards may grow as the borrower begins to make only minimum payments on revolvers.  The borrower may apply for additional credit cards, personal or payday loans   The borrower may apply to increase limits on existing credit cards as outstanding balance nears spending limit  All these stress-indicative behaviors result in a decreasing credit score, many months before the borrower misses their first mortgage payment. An MBS investor with access to each borrower’s current credit score, refreshed each month, can predict increased likelihood of default many months before the first missed mortgage payment—and is therefore at a major information advantage relative to the market generally.  Experian’s Mortgage Loan Performance (MLP) dataset contains thousands of fields describing mortgage performance from each borrower, loan, and property perspective, all refreshed monthly (including, amongst other things, new credit scores and refinance inquiry activity, loan performance on all types of debt, filed junior liens, and AVM values).   MLP is much more comprehensive than loan-level data provided by Freddie Mac, Fannie Mae, Ginnie Mae, and PLS data vendors in several ways:   Standard market datasets may not contain certain data elements that some market participants consider useful when evaluating mortgage prepayment or credit performance. Basic, critical fields such as the borrower’s current credit score and the current junior lien balance on the property are missing.    MLP contains borrower, loan, and property data fields spanning a broad portion of the mortgage universe, including Agency, Non-Agency, and Esoteric mortgage products (CES, HELOC, Reverse), including both securitized and non-securitized loans.   MLP enables full three-dimensional (borrower + loan + property) tracking with persistent keys for borrower (before and after refinancing), loan (in securities/deals even after exit due to payoffs or buyouts, including before and after MSR sales), and property.  This enables end-to-end analysis of each borrower’s (and property’s) mortgage experience throughout their credit lifecycle.  Is Downward-Trending Credit Score a Signal for Impending Delinquency?  MLP contains thousands of fields describing each loan, borrower, and property across all U.S. mortgages.  It allows for virtually unlimited segmentation and granular analysis.   For purposes of this illustrative article, we’ll take a high-level look at the entire U.S. mortgage market and perform a quick analysis to confirm intuition that a declining credit score provides a signal for higher likelihood of near-term mortgage delinquency.  Figure 1 illustrates the current pay status (as of 6/30) for the entire U.S. mortgage market, as contained in the MLP dataset, along with count, UPB and UPB-weighted Vantage 4.0 credit score for each bucket.  Figure 1  Source:  Experian Mortgage Loan Performance dataset  As illustrated in Figure 1, approximately 772,000 individual mortgage loans were reported to Experian as 30 days delinquent as of 6/30/2026.  Of the 772,000 30d delinquent loans in the June snapshot, approximately 426,000 were current in the prior (May) snapshot.  Some of these 426,000 loans were reperformers which had been bouncing from 30 DPD to current over the prior few snapshots. To remove reperformance score noise, we further parsed out the population which: 1) had rolled from current to 30 DPD from May to June; and 2) was consistently current for a full year prior to the 6/30 missed payment.  The population meeting both conditions totaled approximately 123,000 loans.  Figure 2 below shows, for this population of 123,000 “clean current” loans, the UPB-weighted average Vantage4 credit score for each of the 12 months leading up to the June missed payment, as well as the impact of the missed payment on the 6/30 score.  Figure 2  Source:  Experian Mortgage Loan Performance Dataset  Figure 2 reveals a rather slow and steady ~20-point deterioration of score in the 12 months prior to first missed payment – as well as the 80-point drop once the missed payment hits.  When we compare this cohort’s Vantage 4.0 score trend to the broader Current population across the entire dataset in Figure 3, we see a marked difference in both absolute value and trend:  Figure 3  Source:  Experian Mortgage Loan Performance Dataset  Not only is the cohort’s starting Vantage 4.0 score lower than the broader current population, but it also displays a dropping trend (with a notable 2 to 3x acceleration in monthly score drop the month before the first missed mortgage payment) while the broader Current population’s score (of which the isolated cohort is a subset) remains rock steady.  Lastly, we present Figure 4, a histogram comparing the distribution of at-origination and as-of 5/30 (i.e., the period just before the missed June mortgage payment) credit scores for the clean current population. The distribution appears to shift toward lower credit scores. To the extent credit scores are correlated with credit risk, this shift may indicate elevated credit risk relative to origination. Since this degradation occurs during a period of perfect mortgage pay performance, it is invisible to MBS investors who lack access to current borrower credit scores. Experian MLP provides monthly refreshed credit scores for mortgage borrowers contained within the MLP database.  Figure 4  Source:  Experian Mortgage Loan Performance Dataset 

September 22, 2026 by Michael Pyatski, Perry DeFelice
Ask the Expert: The Future of Lending Starts With Identity With Shawn Rife and Brian Cardona

Identity intelligence and alternative data can help lenders validate consumers and support more informed decisions across the customer lifecycle.

September 16, 2026 by Julie Lee

Subscribe to our Newsletter

Enter your name and email for the latest updates.

This site is protected by reCAPTCHA and the Google Privacy Policy and Terms of Service apply.

Subscribe to our Newsletter

Don't miss out on the latest industry trends and insights!
Subscribe