Commercial Pulse Report | 05/19/2025
The latest Experian Commercial Pulse Report reveals a complex but fascinating picture of the U.S. economy and the small business landscape. According to Javier Rodriquez-Paiva’s research, while headline indicators suggest moderation, like slowing inflation and a steady unemployment rate, beneath the surface, disparities in recovery and credit performance continue to deepen. Here’s a breakdown of this week’s major findings.
Watch The Commercial Pulse Update
A Cooling Economy: GDP Contracts, Sentiment Slides
The most attention-grabbing headline this cycle is the 0.3% contraction in Q1 GDP, marking the first quarterly decline since Q1 2022. The Bureau of Economic Analysis attributes the dip to a surge in imports ahead of anticipated tariffs, which disrupted the trade balance and weighed on growth.
Meanwhile, inflation continues to cool. March’s inflation rate landed at 2.4%, down from 2.8% in February, while core inflation—excluding food and energy—fell to 2.8%, its lowest level since 2021. This may offer some relief to consumers and businesses alike, but consumer sentiment dropped sharply to 52.2 in April, reflecting growing unease. It was the fourth consecutive monthly decline, and the lowest reading since July 2022.
Labor Market Holds Steady
Despite the GDP dip, the job market appears stable. April’s unemployment rate held at 4.2%, while the U.S. added 177,000 jobs—a slight slowdown from March, but still a positive sign. Wages rose again, averaging \$31.06 per hour, indicating that employers continue to compete for talent even as other indicators cool.
Small Business Index Ticks Up, Optimism Holds
The Experian Small Business Index rose to 47.2 in March, up from 45.4 in February. That’s the third consecutive monthly increase, signaling moderate optimism among small business owners. However, the index remains 9.3 points below last year’s level, reflecting broader economic uncertainties.
Still, the environment for new ventures remains strong. In March alone, over 452,000 new business applications were filed—a 6.4% increase from February. The rate of business starts has remained significantly elevated since the pandemic, a trend that continues to bolster the small business ecosystem.
K-Shaped Recovery: The Uneven Road Ahead
One of the most critical insights from this report is the continued evidence of a K-shaped recovery—where higher-income households and affluent communities are thriving, while lower-income groups and businesses face mounting financial strain.
Experian’s research shows:
- The top 1% of households have seen income grow over 500% since 1979, while the bottom 20% have only grown by 31%.
- The top 10% hold over 67% of total U.S. wealth, while the bottom 50% hold just 2.4%.
- Retailers in affluent ZIP codes are showing stronger credit performance, including lower delinquency rates, better credit scores, and fewer derogatory filings compared to their peers in low-to-moderate income areas.
These patterns aren’t just numbers—they highlight structural challenges for economic equity and raise questions about how future policy and credit access strategies should evolve.
What This Means for Lenders and Business Leaders
For commercial lenders and business decision-makers, the takeaway is clear: understanding the geographic and demographic context of credit risk has never been more important. The divergence in recovery paths demands more nuanced credit assessment and customer support strategies.
With new business formation still booming and small business owners showing resilience, there are real opportunities—but also growing gaps in financial well-being that could impact portfolio performance over time.
Stay Ahead with Experian
- ✔ Visit our Commercial Insights Hub for in-depth reports and expert analysis.
- ✔ Subscribe to our YouTube channel for regular updates on small business trends.
- ✔ Connect with your Experian account team to explore how data-driven insights can help your business grow.
Related Posts
Experian Commercial Pulse explores how AI is changing credit risk with a fascinating study of high-impact AI industries.
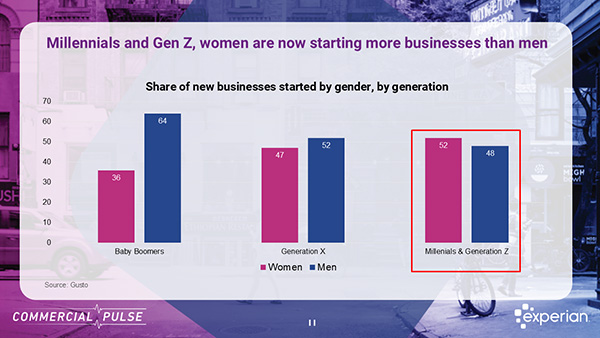
Understand the credit dynamics of women-owned small businesses and their critical role in the growth of the U.S. economy.
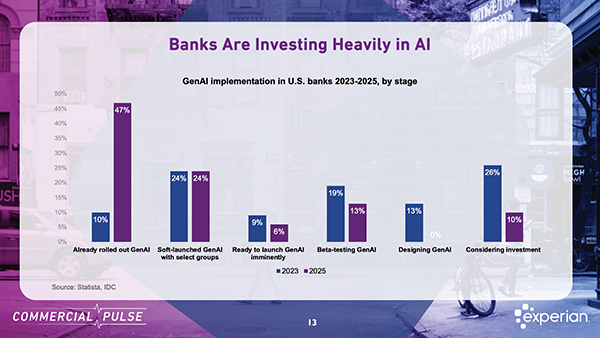
Banking transformation is accelerating through consolidation, digital adoption, and AI innovation. What must CROs prepare for next?