
This holiday shopping season, marketers will look to take advantage of the surge in spending across channels like connected TV (CTV), programmatic, and mobile. Despite challenges such as privacy regulations and Google’s new cookie deprecation plan, this moment presents a unique opportunity for marketers to reshape their traditional approaches to consumer engagement and capitalize on these changes.
As we approach the holiday season, understanding how consumers spend, where they shop, and how their shopping habits are changing are key components to consider when crafting your holiday advertising campaigns. Our 2024 Holiday spending trends and insights report utilizes our expertise in data and insights to highlight emerging consumer behaviors and spending patterns. In our report, we share what these trends mean for marketers and how Experian can help, so you can refine your messaging and target the right audience through the best channels.
In this blog post, we cover three insights from our report. Watch our video for a recap below.
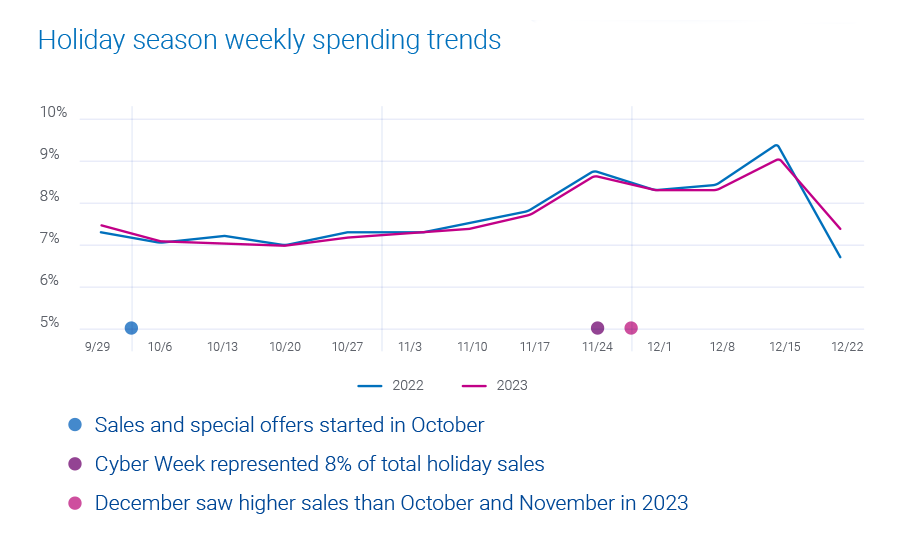
1. Consumers are shopping evenly throughout the holiday season
35% of holiday shopping was done in December, peaking at 9% of total holiday sales the week before Christmas. Cyber Week, the five-day period between Thanksgiving and Cyber Monday, and the week before Christmas brought the highest weekly sales for the past two holiday seasons.
What this means for marketers
Prepare for an extended promotional period. Schedule your marketing campaigns and sales initiatives to maximize impact during the extended season, focusing on the peaks of Cyber Week and the week before Christmas.
How Experian can help you target these shoppers
Experian’s data, ranked #1 in accuracy by Truthset, offers advertisers the ability to reach people based on demographic, geographic, and behavioral attributes (e.g. websites visited and purchase history). Our audiences are available on-the-shelf of most major platforms, making it easy for you to activate and target holiday shoppers.
We recently released 19 new holiday-focused audience segments. Here are a few you can activate:
- Black Friday Shoppers
- Cyber Monday Shoppers
- Big Box/Club Store Shoppers
- Luxury Gift Shoppers
- Discount Holiday Shoppers
- Holiday Airline Travel
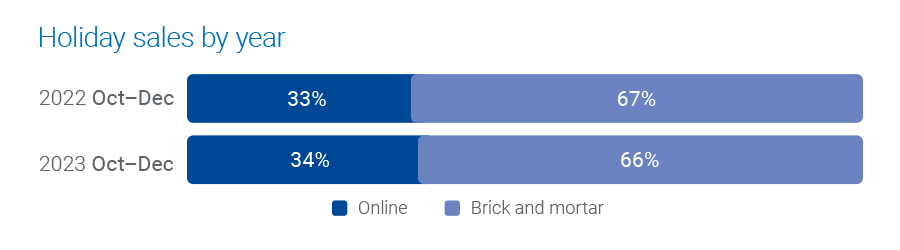
2. Online shopping is leveling out
Online holiday spending continues to remain around a third of all holiday shopping spending.
We are starting to see online shopping slow and level out – people are going back in-store. The high amount of online shopping we saw during the pandemic is starting to return to pre-pandemic behaviors.
Consumers are spending more in-store at department and discount stores but are shopping online for office/electronics/games, mass retailers, and apparel.
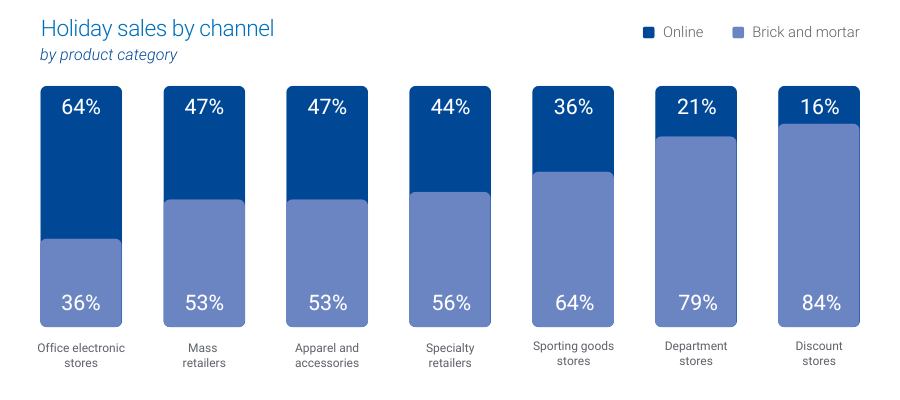
- 84% of holiday shopping was done in-store for discount stores.
- 79% of holiday shopping was done in-store for department stores.
- 64% of holiday shopping was done online for office, electronics, and games stores.
What this means for marketers
Digital and physical experiences work together. Retailers should have a multi-channel plan to reach consumers, tailoring their approach to their target audience and product and creating engaging in-store experiences to drive visitors.
How Experian can help you target and measure across channels
We connect online and offline data to enable precise targeting and measurement of marketing efforts across multiple channels. Read our case study with Cuebiq to learn how they used our Activity Feed solution to deliver in-store lift analyses to their clients.
3. CTV is the top channel to reach consumers
Over two-thirds of the U.S. population now use CTV, and the average time spent among adults is expected to surpass two hours per day in 2024. CTV offers a creative ad experience similar to its linear counterpart but provides more sophisticated targeting and analytics capabilities.
What this means for marketers
As CTV viewing continues to dominate, the importance of cross-device targeting and measurement increases.
How Experian can help you reach shoppers across devices
Later this year, we’ll add support for IPv6 in our Digital Graph as well as phone-based UID2s. This is in addition to our current coverage of IPv4 and email-based UID2s. As a result, all IP signals and UID2s will be resolved back to Experian’s household and individual profiles and their associated devices, which means marketers and platforms can better understand the full customer journey and reach people across their devices.
Download our 2025 Holiday spending trends and insights report
This holiday season is about more than just transactions – it’s about cultivating meaningful connections with your audience. Download our 2025 Holiday spending trends and insights report, in collaboration with GroundTruth, to access all of our predictions for this year’s holiday season.
When you work with Experian for your holiday shopping campaigns, you’re getting:
- Accurate consumer insights: Better understand your customers’ behavioral and demographic attributes with our #1 ranked data covering the full U.S. population.
- Signal-agnostic identity solutions: Our deep understanding of people in the offline and digital worlds provides you a persistent linkage of personally identifiable information (PII) data and digital IDs, ensuring you accurate cross-device targeting, addressability and measurement.
- Secure connectivity: Bring data and identity to life in a way that meets your needs by securely sharing data between partners, utilizing the integrations we have across the ecosystem, and using our marketing data in flexible ways.
Make the most of this holiday shopping season with Experian. Contact us today to get started.
Contact us
Latest posts
Our 2023 forecast for digital audience strategies in AdTech. We reveal the top advertising platforms and the best audience strategies by vertical.

Discover how Experian pairs DASH data with Experian Marketing Data to help marketers develop better TV audience buying strategies.

Advertisers continue to increase their spending across addressable TV, connected TV (CTV), and digital. According to IAB's "2021 Video Ad Spend and 2022 Outlook" report, digital video ad spending is expected to increase by 26% to $49.2 billion in 2022. Understanding who consumers are and how to best reach them in their preferred channel is becoming more complex. Damian Amitin and Colleen Dawe discuss how a seamless identity strategy can address the complexity of the emerging TV space. The evolution of identity resolution Around ten years ago, the idea of digital “identity resolution” or “Device Graphs” was born. This idea connected cookies and MAIDs to understand when many IDs were the same person or household. In more recent years, our industry began to connect that initial understanding to the CTV ecosystem. But, a large part of the TV ecosystem existed in silos, like first and third-party audience data, and the growing advanced TV market. The goal of identity resolution has always been to understand the consumer better. To achieve more accurate targeting and measurement in the CTV ecosystem, we must incorporate the following: What we know about the household and consumer from an ID perspective Who the consumer is as it relates to audience data, as well as the wealth of first-party data in the advanced TV space We know the cookie is a flawed way to collect data. While Google delayed the deprecation of third-party cookies, there are other challenges that we face right now. Such as the glaring gap in Safari traffic and the Identifier for Advertisers (IDFA) turning to “opt-in." Understanding consumer behavior across devices and platforms continues to challenge marketers and publishers. These challenges are creating the need to find more stable identifiers. Though the cookie remains valuable, it has an uncertain future. This has led advertisers to place bigger bets on the combination of addressable and CTV. The overlap in addressable and CTV data leads to fragmentation Personally identifiable information (PII) makes up the majority of addressable TV households' data. Part of the attraction to CTV is that their IDs remain universal, persistent, and stable. Analysts project that CTV ad spending will hit $23B in 2023. Consumers now have an average of 4.7 streaming subscriptions per household. It’s no surprise then, that Disney+, HBO, and Netflix released or announced ad-supported tiers. Addressable TV and CTV are often thought of as distinct markets across the industry. But, in the context of identity, we should look at them through the same lens. Millions of households still consume TV and video content via a set-top box or through apps on CTVs. This is in addition to what they consume on their laptops, tablets, and phones. Of the top 11 cable and satellite providers, 65 million U.S. households still have a box in their homes. On the other hand, approximately 96 million U.S. households have at least one or more Smart TVs and streaming services. With about 126 million total U.S. TV households, that’s a lot of overlap. There are still significant numbers of both addressable and CTV homes. How can we address fragmented TV consumption? Through a holistic and comprehensive approach to identity. An approach that captures addressable TV, CTV, and digital identifiers. An approach that captures all audience attributes inside of a single identity graph. This is the ideal approach for publishers, AdTech vendors, and brands. Discover how to unlock holistic identity How can we achieve a holistic identity? Through a three-pillared approach: First-party data onboarding Digital identifiers Consumer data First-party data onboarding Bringing offline data from a brand’s consumers is very valuable due to the quality of the data. Because the data is being collected right from the source, you know it’s accurate. It provides the foundation you can build your identity strategy from. Digital identifiers Once you create a foundation with first-party data, you need to connect it. Either with an internal or licensed digital ID graph. Then you can understand the connections between all devices within the household. Consumer data After you know which devices tie to a single consumer, you'll want to act on that knowledge. The next step is to partner with a data provider that can help you understand your consumers. Establishing this partnership will help improve targeting, measurement, and the customer experience. To achieve a well-rounded customer view tomorrow, we need to start today The three-pillared approach bridges the gap between the offline and online worlds. This provides a well-rounded view of customers and audiences. However, the ability to tie these aspects of identity together still presents several challenges. To achieve the three-pillared approach today, you need to use many vendors and fragmented data sources. Often with conflicting data. As we look forward, the tools to do this are becoming more advanced and unified. The players in our ecosystem should adopt a seamless identity strategy. One that provides a privacy-safe yet full-picture solution. That means capturing and unifying all devices within a household. While also understanding the consumer behaviors and profiles behind those devices. Keep up with your customers and their data Once we create an informed identity strategy, we can begin to understand the makeup of each household and the individuals within. In this new world, personalizing the experience for an audience is key. Where do they prefer to spend their time? What type of content are they most engaged in? Only then can we as an industry provide an optimal experience for each consumer. All while driving greater ROI for advertisers and publishers. Are you ready to know more about your customers than ever before? Let's get to work together to achieve your marketing goals. Contact us to learn how we can connect the complex dots of identity resolution. About our experts Damian Amitin, VP of Enterprise Partnerships, Experian Marketing Services Damian Amitin is the VP of Enterprise Partnerships and joined Experian during the Tapad acquisition in November 2020. Damian is a senior sales and partnerships executive, specializing in the identity resolution and marketing data ecosystem. Damian helps brands, publishers, and technology vendors enable enhanced ID resolution through The Experian/Tapad platform to attain a 360 view of the customer across targeting analytics, attribution, and personalization. Colleen Dawe, Senior Account Executive, Experian Marketing Services Colleen Dawe is a Senior Account Executive on the Advanced TV Team within Experian Marketing Services. With 15 years of experience working within the television ecosystem, Colleen works with clients to bring the value and expertise of Experian to support their objectives in the areas of data, identity, activation, and measurement. Get in touch