At A Glance
Brands can scale local marketing without losing brand consistency when they separate fixed brand elements from variable local decisions and automate only where the stakes are low. In this Ask the Expert conversation, Experian and Butler/Till discuss how brands can spot real local signals, decide what to automate, and keep people in the loop on decisions that carry brand risk.Key takeaways
- Manual oversight of local marketing tends to break down at around 100 store locations, according to Butler/Till, since decision latency makes it hard to keep pace with simultaneous market-level calls.
- Butler/Till recommends separating fixed brand elements, like voice and positioning, from variable ones, like media mix, audience targeting, and local partnerships, when scaling marketing across many store locations.
- When comparing a local campaign’s performance against a market baseline, a gap of 20% or more usually signals something real, while a gap of just a few percentage points is more often noise.
- Brands running local campaigns across thousands of store locations can automate budget allocation within clear guardrails, but should keep people in the loop on creative selection and other brand-risk decisions.
In our Ask the Expert series, we interview leaders from our partner organizations who are helping lead their brands to new heights in advertising. Today’s interview is with Ryan Lammela at Butler/Till.
When a national brand says it wants to market locally, what does that usually mean to them, and what does effective local marketing require? Where’s the biggest gap between the two?
Most national brands think “local” marketing means communicating the same message with different prices. They want consistency at scale, without surrendering national control. Effective local marketing requires something more demanding: adapting strategy, not just price, to each market’s competitive intensity, seasonal patterns, media preferences, and regulatory environment, while keeping brand integrity intact.
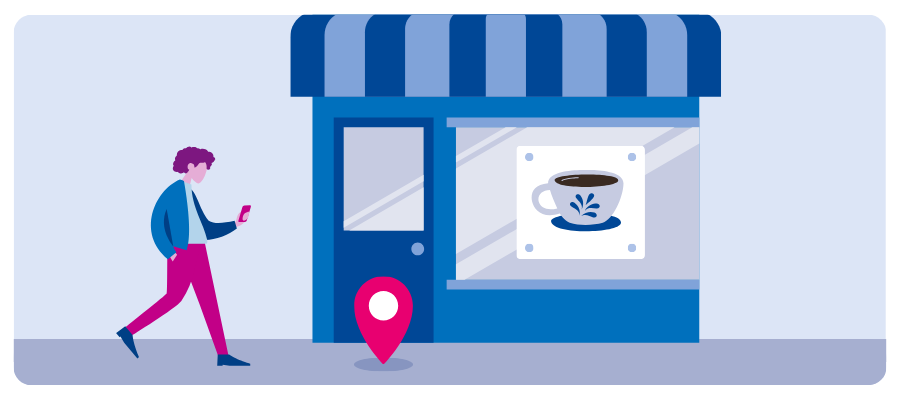
The biggest gap between national and local marketing is structural. Brands underestimate how different markets actually behave. A media mix that works in Seattle might fail in a small rural town in the Mid-Atlantic. Local audiences respond to different messaging angles. The friction comes from centralized decision-making trying to enforce one strategy across fundamentally different market dynamics.
What we’ve found is that successful brands need a framework that distinguishes fixed elements from variable ones. Brand voice and core positioning? Fixed. Media mix, audience targeting, local partnerships? Variable. Without that clarity, you get either chaotic fragmentation or missed local opportunity.
At what point does scale fundamentally change how you have to operate? What starts to break when you move from 50 or 100 locations to tens of thousands of campaigns?
In our experience, the breaking point tends to show up around 100 physical locations. Below that, marketers can still oversee most decisions. Beyond it, you hit the wall: you can’t have people make thousands of media decisions monthly and stay competitive on timing or cost.
Coordination breaks first. When you’re managing multiple channels across multiple markets, decision latency becomes critical; manual approval chains that worked at 50 locations can’t keep pace with thousands of simultaneous market-level decisions. Execution consistency degrades because there’s no visibility into what’s actually running everywhere.
Then measurement becomes a nightmare. You’re collecting data from dozens of sources: platform dashboards, local partners, point-of-sale systems. The noise drowns out signal. Without a consistent way to tie those sources back to the same person or household, you’re comparing apples to oranges across markets.
What’s a pattern that can come to light when you can compare results across thousands of campaigns, something you wouldn’t have trusted from a single market?
When you run 5,000 campaigns across 4,000 locations, patterns emerge that a single market would never reveal. A media mix that looked like a failure in one market? It works in similar demographic clusters. A creative asset that seemed like an outlier? It’s the winner among underserved audiences nationally.
You also spot seasonality patterns you’d miss regionally. When you compare July performance across 2,000 markets, you learn that summer media preferences shift in ways single-market data would dismiss as noise.
Local markets behave differently. How do you decide which local signals are worth acting on versus which are noise, and what data are you leaning on to tell the difference?
Telling a real local signal from noise starts with a baseline: establish expected performance benchmarks across similar market clusters, then look for deviations that are large relative to a market’s normal swing. A gap of 20% or more usually warrants investigation; something in the low single digits is more often noise.
Layer in market context: competitive intensity, demographics, media consumption patterns, seasonality. When a campaign spikes in one market, ask why. Is the market fundamentally different, or are we optimizing for the wrong thing?
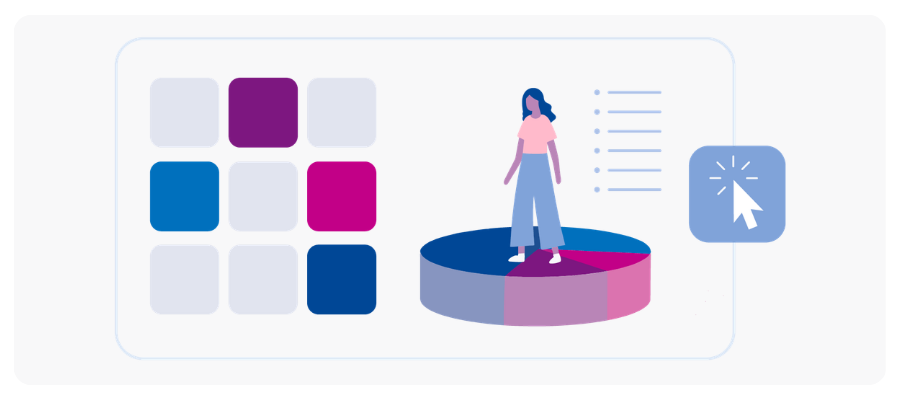
Local signals worth acting on are consistent across similar market types, tied to something measurable (seasonal shift, competitive move, audience behavior change), and actionable without breaking brand consistency.
The data that matters most is comparative data, not absolute performance. When Phoenix outperforms Denver on a tactic, and both are similar sunbelt markets, that’s worth investigating.
With that volume of decisions, where do you let the system decide and where do you still want a person in the loop?
Automate based on decision complexity and consequence, not based on volume.
Budget allocation across channels within a market? The system could handle it. The variables are clear, the data is clean, and wrong decisions are recoverable. We set guardrails—don’t shift more than 15% week-to-week, don’t kill a performing channel below threshold—and let optimization work.

Creative selection or messaging? That stays with people. Those decisions carry cultural and brand risk that algorithms can’t weigh. Same with market-level strategic pivots or major partnerships.
Audience targeting is trickier. There’s a lot of data, patterns aren’t always obvious, and bad targeting ripples through the program. We build algorithmic recommendations, but a strategist validates them against market context. The algorithm says shift audience targeting toward women 35 to 44. The person asks why and either confirms the insight or catches something the algorithm missed.
We also keep humans in the loop for anything that breaks the established playbook. When a market starts behaving unexpectedly, we escalate.
The rule: automate routine, standardized decisions with clear success metrics. Keep people in the loop on decisions that shape strategy or carry brand risk.
What have you learned running local programs at this scale that a brand with 50 or 100 locations could apply on Monday?
Brands running campaigns for 50 or 100 locations should start by building their decision framework before they build their system. Know which decisions are local and which are national before you automate them. We’ve seen brands implement tools that actually slow them down because they skipped this step.
Establish market benchmarks now instead of waiting until you’re at scale. Group your locations by similarity and start comparing performance across similar markets. You’ll spot inefficiency fast and understand what good performance looks like in different market types.

Treat automation as a channel tool, not a thinking replacement. Ask yourself what decisions are slowing you down. What insights are you missing because you don’t have bandwidth? Start there, not with the fanciest tech.
Invest in measurement rigor. When you’re coordinating across multiple locations, measurement becomes competitive advantage. Know which metrics matter locally and which are noise. Build data infrastructure to compare performance across markets without creating reporting chaos.
And here’s what matters most: successful local marketing at scale gives local teams better information and faster decision velocity while maintaining brand guardrails. That balance—autonomy with consistency—is where real leverage lives.
Thanks for the interview. Do you have any recommendations for our readers if they want to learn more?
If your brand is managing multiple locations and feeling friction, the question isn’t “should we automate?” It’s “which decisions are slowing us down, and why?” Start there. Talk to teams running campaigns in the field. They’ll tell you where the friction actually is. Then build systems to solve that friction, not to solve a problem you think you have.
Contact us
Click here to view Experian’s U.S. Consumer Data Privacy Notice.
This site is protected by reCAPTCHA and the Google Privacy Policy and Terms of Service apply.
About our expert

Ryan Lammela
VP of Channel Activation, Butler/Till
Ryan Lammela is VP of Channel Activation at Butler/Till, an independent media agency. He leads media execution strategy for brands managing distributed marketing across hundreds or thousands of locations, translating integrated strategy into measurable market impact at scale.
FAQs
Butler/Till defines effective local marketing as adapting strategy, not just pricing, to local market conditions like competitive intensity, seasonality, and media preferences, while keeping core brand voice and positioning fixed. Most brands think local marketing means the same message at different prices, which misses the structural differences between markets.
Manual oversight tends to break down around 100 locations, according to Butler/Till. Below that threshold, people can still review most decisions directly; beyond it, decision latency and inconsistent visibility start to undermine execution.
A performance gap of 20% or more against a market baseline usually signals something real, while a gap of just a few percentage points is more often noise. Butler/Till recommends grouping similar markets, setting expected performance benchmarks, and investigating deviations tied to a measurable cause like seasonality or a competitor’s move.
Budget allocation within clear guardrails is well-suited to automation, since the variables are clean and mistakes are recoverable. Creative selection, messaging, and market-level strategic decisions should stay with people, since they carry brand and cultural risk that algorithms aren’t built to weigh.
Experian’s identity resolution and measurement capabilities help brands tie data from disparate local sources, like platform dashboards, local partners and point-of-sale systems, back to the same person or household. That consistent view is what allows comparative analysis across markets to actually hold up, rather than comparing apples to oranges.
Latest posts

Overview Chartable leverages The Tapad Graph to improve cross-device attribution rates and remove non-addressable IPs for clients. Challenge Chartable needs to differentiate between consumer and potential business IP addresses to provide accurate household modeling and reduce excess data for their customers. Podcasting generally only has access to IP addresses as a form of digital ID which limits its ability to connect activity to individuals and extend it across all devices. The Tapad + Experian solution Using Tapad, now a part of Experian, Chartable is able to cut through the noise of IP data and discard any addresses deemed a shared IP or business. Then, Tapad + Experian connects individual users to their other digital IDs and users in their household; creating a richer attribution model for Chartable customers. Increase in podcast attribution rates Contact us today

With the growth of digital marketing and the targeting capabilities associated with online outreach, many predicted that this would mark the end of direct mail advertising. But if Millennials have anything to say about it, that’s not going to happen anytime soon. Yes, believe it or not, Millennials are driving the resurgence of direct mail advertising, and many leading brands are now pivoting their omnichannel marketing plans to include direct mail. And with the USPS reporting more than 75.7 billion in marketing mail volume in 2019, this trend shows no sign of slowing down. Including direct mail in your plans may give your brand a better chance of reaching your audience. Why? 1. Millennials actually like getting mail.While most of us have decried “junk mail” as being environmentally unfriendly or just a pain to deal with, Millennials actually enjoy physical mail. Valassis recently cited research from USPS Customer & Market Insights stating that Millennials spend the most time sorting mail (about six minutes compared to the average, which is four minutes), plus they’re opening mail and reading it (at eight minutes versus the average of seven minutes). Valassis also conducted a study that showed that 68% of Millennials read print ads or inserts from retailers, and 64% prefer getting them through the mail. So, while digital outreach may be convenient, it hasn’t completely decimated the desire for that old-school, hands-on experience of opening and reading something that’s addressed to you. 2. Millennials respond to a multi-channel approach.Oftentimes, marketers think of omnichannel as being a combination of digital and TV, but when you add print into the mix, it can make an even bigger impact on Millennial audiences. Valassis found that 60% of consumers are more likely to make a purchase after seeing an ad when it’s presented across both offline and online channels, while 72% of Millennial parents say print ads encourage them to go online and make a purchase from that retailer. 3. Millennials think physical mail makes for a more personal approach.You’d think that e-mail would feel more personal, but with the influx of spam most people get, that’s just not the case. In fact, 67% of people see physical mail as being more personal than an e-mail, with seven out of 10 saying they prefer receiving actual mail over digital mail. And for marketers looking to make a one-to-one connection, this is music to their ears. With changing marketing plans, the mailbox has less competition than the inbox. Getting a catalog at their door with the perfect offer at the perfect time helps the marketer make the direct connection. 4. Direct mail lasts longer than digital mail.That may seem like an obvious statement, but there’s more to it than you think. When an e-mail arrives in someone’s inbox, it’s easy to ignore it, read the subject line and forget about it, or even just randomly delete it, if spam filters don’t take care of that on their own. But the average lifespan of a piece of direct mail is 17 days, which may account for how direct mail generates purchases five times larger than e-mail campaigns. It’s harder to ignore when it’s in your house and you have to physically handle it as opposed to just clicking a mouse to get rid of it. 5. Millennials trust direct mail.It’s true—research shows that 90% of Millennials think direct mail advertising is reliable. Plus, Millennials are 24% more likely to show mail to others, compared to 19% of non-Millennials… which means if they find a deal they like in the mail, they’re probably going to spread the word. Contact us today
Marketers are always looking for creative ways to get the most out of their digital marketing investments. While there may be different paths to optimization, reducing media spend and cutting costs without sacrificing ROI is ideal. We empower marketers to take back control of their budgets and reinvent their media strategies by leveraging the right data at the right time. And, given today’s challenging climate, there’s no better time. Every Business Has Different Deeds Whether you’re a direct-to-consumer brand building a loyal customer base or a financial service simply letting customers know you’re here for them during a challenging time– identity resolution is essential to connecting with your audience without breaking the bank. That’s why we have built solutions that provide flexibility and control when you need it most. Putting Data Into Action Experian’s “Tapad Graph” is a global, privacy-safe cross device graph is one powerful file. Updated weekly, and containing customized device IDs and digital attributes, The Tapad Graph enables smarter targeting strategies and a reduction of wasted impressions. What that means is more marketing efficiency and a stronger ROI for your business. Saving resources and money sound good to you? This guide breaks down four ways you can implement cost savings measures without sacrificing performance or prohibiting KPIs. Frequency Capping and Suppression Clustering device IDs by the individual and household means you have access to more ways to reach consumers, but it doesn’t always mean you should be using all of them across every campaign. Hone in on the channels and devices where consumers make most of their lower funnel decisions and purchases – and cap brand-awareness level placements or aspirational media that requires more exposure to generate engagement. This doesn’t mean limiting the devices you target, but being more aware of how often you’re targeting the same person across those devices. If you’ve successfully begun, or heck, even completed the consumer journey with an individual, congratulations. Now, you may want to consider what to do with the rest of the digital devices and users in that same household. Sure, there’s a time for conquesting an entire home of purchasers, but that’s not always the most effective way to maximize your media. That’s why The Tapad Graph is built to be flexible, providing a holistic view of all individuals and their associated devices and digital IDs – so you can suppress them once you’ve conquested the household decision maker or achieved the desired lower funnel activity. Save those impressions for someone else and save money for yourself. The great thing is whether you’re uploading this data into a DMP or a DSP, you can segment your target audience with a frequency cap threshold or suppress them entirely. Not only can you apply these tactics across traditional digital media, but we can include Connected TVs for OTT targeting as well, making your media strategy as holistic as your identity resolution tactics. Cross-Device Targeting and Attribution Consumer behavior and device trends are changing these days, so shouldn’t your digital marketing change too? Desktop usage is now up as much as 22%* as more people are working and learning from home. And remember that old iPad? With more people at home, we’re dusting off more devices and tablet activity is increasing more than 30%*. Sure, people are still constantly on mobile– but it might be time to consider implementing cross-device targeting and optimization for those dayparts when their focus is elsewhere. Identity resolution should be a key element of customer journey mapping and attribution in order to truly give credit to the right channels and build a baseline for the right cost-per modelling. Coupling The Tapad Graph with raw events data can granularly attribute engagement, actions and conversions at the digital ID, device, and even user-level – thereby teaching you more about your customer’s preferences. Leverage these insights to create more tailored messaging and promotions on your owned and operated channels, to funnel impressions to specific screens and platforms, and to target users based on where they are in the purchase funnel. Data That Gives You Control If you’re already implementing cross-device, have you started suppressing the devices where engagement with your brand isn’t happening? That’s right, you can use The Tapad Graph after-the-fact as well. Weekly graph updates with 60-day look-backs enable weekly campaign optimizations. That gives you the flexibility and control to avoid devices and platforms where users aren’t as active. You can only make decisions based on the data you have in front of you, so make sure you’re partnering with the right solutions for your business. Does identity resolution sound like something you need? Contact us and we can help you get started with all that The Tapad Graph has to offer. Contact us today