New Experian Report: Beyond the Trends Experian Business Information Services is excited to present our new quarterly report "Beyond the Trends." In this report, we'll be evaluating challenges to particular industries. We'll be looking at account management, pre-treatment, and treatment strategies for small businesses coming out of COVID. The Winter edition has just been released, download your copy below. . Download Report
We get a lot of questions from our customers about blended credit scores vs consumer scores so, for our latest Fast FUNdamentals session, I thought it would be helpful to share what makes blended scores so powerful, and something you should consider when granting credit to small businesses. Watch our video or read the post, and remember to share it with your friends and colleagues. Small business growth fuels the U.S. economy through job creation and innovation! Small businesses support regional and local economies throughout the country, with higher proportions in middle America, and for every Walmart, Amazon, and Google, there are thousands of small business manufacturers, distributors, resellers, and app developers supporting their growth as well. In order to grow, small businesses need good ideas, a good business plan, hard work, and access to capital. Good credit is required to access capital, and many creditors look at the business owner’s consumer credit information from bureaus like Experian, to determine creditworthiness and credit risk. They tend to see small businesses and small-business owners as one and the same. However, this strategy is not always successful. The average consumer profile is quite different from the average business owner. Let’s look at how the profiles compare on some general consumer attributes associated with credit risk. The average owner has more trade experiences and has a longer credit history, which indicate lower risk. However, the owner also has higher credit utilization, which commonly indicate higher risk. Does this mean that the average owner is a higher credit risk than the average consumer? Not necessarily. Many small business owners rely to an extent on their personal credit to help finance their business. For public records, such as tax liens, judgments, and bankruptcies, the average is low for both the average consumer and owner. For collections, the average consumer has 5 times the amount to that of the owner. That’s indicative of higher risk. Another major indicator of credit risk is severe payment delinquency, and again, the average consumer is much more likely to be more severely delinquent than the average owner. Given that the average business owner looks and behaves differently from the average consumer, is there a better way to assess small business credit risk? A better way to assess small business risk Experian conducted a study to look at the relationship between the business and the owner’s credit behaviors over 3.5 years, to determine the strength of that relationship. We tracked the percentage of those businesses and owners that continued to remain credit active and healthy, and those that became high credit risks, becoming 91+ days delinquent on over 35% of all trade obligations. Over 3.5 years, 79% of the time, both the business and owner’s credit remained healthy. We tracked the percentage of those businesses and owners that continued to remain credit active and healthy, and those that became high credit risks, becoming 91+ days delinquent on over 35% of all trade obligations. Over 3.5 years, 79% of the time, both the business and owner’s credit remained healthy, and 5% of the time, both the business and owner became severely delinquent on the business obligations and on the personal credit obligations. That means that 84% of the time, the end result of business and consumer credit is the same! That’s a very strong correlation, so the owner’s consumer credit behavior is very indicative of business credit behavior. But, that also means that 16% of the time, the outcome of the business and consumer are diametrically opposed. 9% of the time, the business goes bad, but the owner stays good. If a creditor were to approve a business for credit based on the owner’s credit profile, the creditor would have made a bad decision. Furthermore, 7% of the time, the consumer goes bad but the business stays good. Blended risk scores provide better commercial risk assessment Blended risk scores predict business risk by utilizing the owners’ consumer credit attributes with the business credit attributes together – to calculate a more comprehensive risk score for the business With the blended risk score, creditors can more confidently approve those with a great score and know that they will have a profitable customer. And they may have to decline those with a high-risk score to mitigate against future loss. Let’s compare the predictive power of three risk models as the business ages, from infancy to full maturity In the below illustration, the horizontal axis going across measures the business as it ages, from 0 to 2 years on left, to 21+ years old on the right. The risk models compared are the Blended model, Commercial only model and Consumer model. Again, the Blended model uses both the business and consumer credit information to calculate the business risk. The Commercial only model uses just the business credit data to predict business risk and the Consumer model uses consumer credit data to assess the risk of the consumer, which is the business owner. The vertical axis measures KS, which is a metric representing the predictive power of each model in accurately identifying future good vs bad business credit outcomes. The KS is scaled from 0 to 100, with 0 indicating no predictive power and 100 Indicating perfect prediction. So, higher values indicate stronger model performance. For businesses in infancy up to 2 years, the Consumer risk score is more predictive of business risk than the Commercial risk score. That may seem counter-intuitive, but the underlying reason is that new and young businesses do not have a lot of credit activity on their profile. Many young businesses are actually funded by the owner’s personal credit, so there is less business credit information to calculate the business score. And in general, the less information available, the less predictive a model score will be. As the business matures, it establishes and expands its credit profile, opening more tradelines in the name of the business. As the business profile becomes richer in information, the commercial risk becomes more predictive than the consumer score. The business becomes a separate entity, and the consumer score becomes less and less indicative of business risk. Behaviors can differ dramatically from the business owner, as we have seen in previous examples. As expected, across all the ages of the business, the blended score provides superior performance. The blended score takes the age of the business into consideration as one of the factors for calculating risk, at every stage of the business lifecycle, the blended score provides a more holistic risk of the business by integrating the dynamic relationship between the business and owner credit profiles. Small business owners represent a unique market. They have an evolved sense of purpose, discipline, and responsibility that allows them to accept the risks and hardships required to build an enterprise from the ground up. To properly evaluate an entrepreneur’s credit risk, creditors must look at the right score. Utilizing a blended score is a proven, better way for creditors to evaluate risk and extend worthy businesses the capital they need to grow and prosper. And, as small businesses succeed, we all benefit.
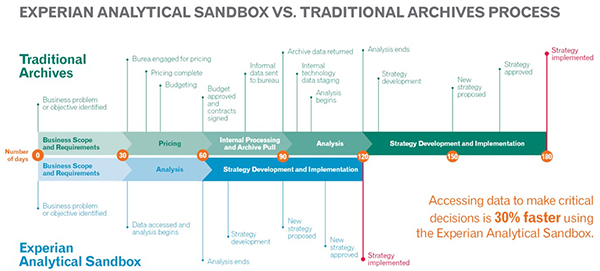
Making fast, accurate decisions on businesses is critical, especially during uncertain times. Having an edge on your competition matters, from productivity to profitable growth. For risk managers and data analysts, the stakes could not be higher. In response to that market need, Experian Business Information Services recently announced the availability of the Ascend Commercial Suite, a data and analytics platform which currently enables the following three capabilities: Commercial Analytical Sandbox - enables immediate access to multiple data sets, including our commercial, premier consumer attributes, and SBFE data, with new data snapshots automatically added monthly. Experian built Commercial Analytics Sandbox on the same OneExperian Technology Platform that won a FinTech Breakthrough Award for Best Overall Analytics Platform in 2019. It is compatible with multiple leading analytics packages and cutting-edge tools, including RStudio, R, Python, H2O, and SAS Viya. Benchmarking Dashboard - Small Business Financial Exchange members can tap into powerful portfolio views using Tableau. The Benchmarking Dashboard offers access to all data and multiple data sets so clients can compare their portfolios against peer populations, and analyze new market segments for potential expansion. Ascend Data Services - For clients who want to run analytics using their software tools. Ascend Data Services offers a delivery method that enables the flow of linked data into a client-owned environment, making Ascend Commercial Suite extremely flexible to whatever tools clients are using. Eliminate barriers to data and analytics while holding down IT costs Our clients have often mentioned the time and labor-consuming process of appending archive data. They also describe lengthy procurement processes to acquire additional data. With on-demand access to the freshest data, clients can focus on customers and be more responsive to market changes by providing KPI’s to key stakeholders, all while holding down IT costs. Manage your portfolio more effectively You can create Tableau-enabled dashboards to monitor portfolio performance and quickly identify areas of strength or concern without running custom reports every month. Spotting shifts in risk profiles or identifying cross-sell and up-sell opportunities helps you to maximize portfolio performance. Model development Perhaps the most potent aspect of Ascend Commercial Suite is the modeling tools. Here you can design, develop, and validate models (including marketing, risk, collections, 3rd party) and scorecards to find, approve, and manage new and renewal accounts. Run retroactive analyses on the fly to establish risk-based credit loans or loan amounts to better control through-the-door risk and prevent loan losses. We are incredibly excited about the possibilities Ascend Commercial Suite unlocks for our clients. If you would like to learn more or schedule a demo, please reach out to Experian today.
Experian and Moody's Analytics have just released the Q3 2020 Main Street Report. The report brings deep insight into the overall financial well-being of the small-business landscape, as well as offer... Experian and Moody's Analytics have just released the Q3 2020 Main Street Report. The report brings deep insight into the overall financial well-being of the small-business landscape, as well as offer commentary on business credit trends and what they mean for lenders and small businesses. In a fight for survival, small businesses have turned to layoffs and borrowing as they attempt to reach the other side of COVID-19. The increased borrowing is helping to mask rising late-stage delinquencies and bankruptcy. But these tactics can only mask weakness for so long. With another round of government stimulus unlikely to arrive before year's end, small businesses will need to borrow for survival again. While we did see some jobs come back in Q3, small business payrolls have shrunk by more than 2 million from this time last year. The hardest hit are those businesses with 1-19 and 20-49 employees; both of these groups saw payrolls shrink by 1 million employees. The 31-90 days past due (DPD) delinquency rate on small business credit plunged to 1.25 percent in the third quarter. This ended the streak of increasing delinquency we had observed for the last year. However, this is likely to be short-lived, as the US appears to have entered a new phase of the COVID-19 pandemic with cases again on the rise. Commercial and Industrial loans continued to run hot. C&I numbers are a lagging indicator, so the latest numbers reflect the second quarter. At that time new C&I lending was 21 percent higher than in the same period a year ago. If you would like to get the full analysis of the data behind the latest Main Street Report, join us for the Quarterly Business Credit Review webinar.
Credit risk scores predict credit risk in the near future, based on the credit profile of the business as of today. So you have a new applicant. What do you do? You get that credit risk score for those applicants with a great score; you're going to approve them and hope they'll be good customers for life. For those applicants with a high-risk score, you may have to decline them. This is the way it's supposed to work, but how do you know if the risk score works for your portfolio? What is the risk associated with the score specifically for you? To understand the risk of the score for your applicants, you can start scoring all new applicants as of today and wait 3, 6, 12 months. But who has the time to wait a year to see if the score predicts good versus bad outcomes accurately? Watch our 5 Minute FUNdamentals Video A more immediate way is to score the newly booked accounts from a year ago and compare the score at application with the performance up to today. This process is called model validation. It's possible because Experian archives a snapshot of all business credit profiles and scores monthly going back more than a decade. Model validation results are represented through a performance table or odds chart. Let's go over a simple model validation odds chart. The risk score is scaled from 1 to 5, with 5 indicating the lowest risk and 1 indicating the highest risk. Younger businesses, businesses with minimal credit experience, or companies with severe delinquencies or collections would score low. This table shows the number of accounts that got each risk score. These columns show the number of accounts that say good or went bad within the first 12 months of account opening at the point of application. This is the bad rate for each score by knowing what the risk of the score is for your portfolio. You can understand the risk of new applicants going forward. A common metric used to determine a risk score's predictive power is KS named for its craters, Kolmogorof and Smirnoff. KS measures a score's ability to separate two populations. In this case, future goods and future bads. If more bads get lower scores and more goods get high scores, then the model is doing an excellent job of predicting credit risk. Let's quantify how good the model is performing by calculating KS. We see that 20 accounts got the worst score - a 1, and 12 of these accounts stayed good within one year of opening, and eight of these accounts went bad within one year of opening. Now let's add some columns that calculate values from the worst score on up. These are called the cumulative calculations. At the worst score of 1 there are eight bads captured out of 20 total bads, which is 40% of all bad accounts. At the score of 1 to 2 there are 14 bads captured out of 20 total bads, which is 70% of all bad accounts. At the score of 1 to 3 there are 17 bads captured out of 20 total beds, which is 85% of all bad accounts. Finally, at score of 1 to 5, there are 20 bads captured out of 20 total bads, which is 100% of all bad accounts. We go through the same calculations for the percentage of good captured. Let's calculate that KS now. At each score range, we subtract the percentage of goods captured from the percentage of bads captured. The KS is just the maximum difference between the percentage of bads captured and the percentage of goods captured. The KS is scaled from 0 to 100 with 0 indicating no ability to predict good versus bad outcomes, and 100 indicating perfect prediction. Let's see a model that can not predict credit risk at all. This model captures the same percentage of goods and bads at each score. So the maximum KS is zero. Now let's see how a model can get to a KS of 100. There it is, all bads got the worst score of 1 and no goods. All right, now that we understand how well the risk score predicts risk, let's discuss how we can apply your odds charts, make data-driven decisions. Let's say on average, you make $100 dollars on every excellent account, but you lose $200 for every bad. For each score we calculate the net profit by multiplying the number of goods by profit per good. Net loss by multiplying the number of bads by loss per bed. Now let's calculate the cumulative net profit and loss from best to worst score. We're simply summing the net profit and net loss amount as we go from a score of 5 down to 1. Lastly, we subtract the cumulative net loss from net profit at each score to determine the score cut. To maximize profit for all the accounts that score a 5, we're making a profit of $1,700. As we add lower-scoring accounts, our maximum profit continues to increase. When we add the accounts at score 1, the maximum profit decreases by $400. This means that we maximize profit by approving everyone that scores 2 and higher. For those that score 1, there are 20 accounts, and we're losing $400 from them. We can choose to decline them or charge them a deposit of $20 or more to be profitable because we're losing $20 on average per account here.
The concept of machine learning has been around for 50+ years in analytic circles. But machine learning methods have created a stir in the last few years as their popularity and visibility increased in the U.S. consumer and commercial credit industry. The use of these advanced methodologies has been constrained to mainly fraud/identity and collections. Machine Learning techniques are now available for credit decisioning. Our upcoming Sip and Solve session will provide insights to help your regulator feel more comfortable with the methodology you are using. We will share how Experian is making machine learning explainable to regulators and boosting model performance. During this session you will learn three take-aways: Current model governance basics How machine learning methods are boosting performance Best practices in deployment and documentation to help regulators feel comfortable with this more powerful solution
Supplier risk management has become a top priority for procurement and supply chain professionals. With rising regulatory and compliance fines and the global market disruptions caused by trade wars and the pandemic, a robust supplier risk management program is crucial. Gerard Smith, President and Co-founder of Global Risk Management Solutions, shares insights on creating a world-class supplier risk management program. In this interview, discover the essential components and strategies to effectively manage supplier risk and ensure compliance and stability in your supply chain. Evolution of Supplier Risk Management Practices Twenty years ago, when I was in procurement, many organizations self-performed everything. In other words, they collected documents and validated them as best as they could. The issue today is with COVID. With COVID, many companies are concerned. The two things we keep hearing about is the financial stability of the suppliers. Are they financially stable? Not only today, but in the foreseeable future, and secondarily, do they have insurance to protect the client company if there are any errors. So, it's the financials currently, and the insurance companies are most concerned about monitoring. Increasing Complexity in Supplier Risk Management Companies are starting to source globally, and more and more companies are concerned about the supply chain and if there are issues, whether geopolitical or whatever the case may be. So the idea here is to manage supplier risk proactively, and so there are three components of that. First, based on a client's requirements - the ability to do the risk assessment based on specific risk components. Second, having a help desk to try and troubleshoot where there are issues with the suppliers to help them to get into compliance. And third, most importantly, being able to monitor those suppliers for changes in status and getting actual push alerts, to be able to act on those. So, in other words, getting in front of the problem versus finding out that a supplier perhaps filed bankruptcy or showed up on a government watch list or something like that. Key Components of a World-Class Supplier Risk Management Program If a company wishes to have a world-class supplier risk management program, there are five crucial components that you would want to see, they are: Customized Risk Program A Customized Risk Program is tailored to address specific risk components relevant to a company's unique needs. This customization can take various forms: Geographical Considerations: Different regions, such as EMEA (Europe, Middle East, and Africa) and APAC (Asia-Pacific), have distinct regulatory requirements and market conditions. A Customized Risk Program can adapt to these regional differences, ensuring compliance and appropriate risk management practices in each area. Spending Levels: Companies often have both strategic and non-strategic suppliers. Strategic suppliers, with whom the company spends more, may require a more thorough and detailed risk assessment compared to non-strategic suppliers. Customizing the risk program based on spending levels ensures that critical suppliers are monitored more closely. Specific Risk Factors: Different industries and companies face unique risks. Whether it's financial stability, compliance with specific regulations, or reputational risks, a Customized Risk Program can focus on the most relevant risk factors for the company. The key objective of a Customized Risk Program is flexibility. It must be able to adapt to various factors such as geography, spending, and specific risk elements, ensuring it is not a one-size-fits-all solution but rather a bespoke approach to managing supplier risk effectively. Adjudicating Information This involves the critical process of verifying and clarifying data to ensure accuracy. This means systematically identifying and eliminating false positives, which occur when incorrect or irrelevant information is selected. For instance, if you input "Bob's Plumbing" into a database, you might receive numerous results for companies with similar names. The challenge is to determine which "Bob's Plumbing" is the correct one that your company works with. Adjudicating information requires sophisticated methods to accurately select the correct entity and cross-verify the details, ensuring that the data is precise and applicable to your specific supplier. This process is essential for maintaining the integrity and reliability of your supplier risk management program. Reporting In a supplier risk management program, reporting capability is vital for maintaining consistent and measurable compliance standards. This involves generating real-time, standardized reports that provide current risk ratings for all suppliers. With these reports, management can quickly identify which suppliers are in compliance with set standards and which are not, along with the reasons for non-compliance. Additionally, the reports highlight any ongoing issues within the supply chain, enabling management to address problems promptly. Effective reporting ensures transparency, accountability, and the ability to make informed decisions based on up-to-date risk assessments. Document Verification and Monitoring In a supplier risk management program, Document Verification and Monitoring is crucial for ensuring the authenticity and accuracy of the documents submitted by suppliers. While collecting and managing documents can be straightforward, the challenge lies in verifying their validity. Many procure-to-pay, source-to-pay, and ERP platforms face this issue, as they often rely on suppliers to upload documents without proper verification. This can result in the acceptance of invalid or even blank documents. To address this, a robust system or process must be in place to validate key documents such as certificates of insurance, W9 forms, and other critical documentation. This system should not only collect documents but also authenticate them, ensuring they meet the required standards and are current. Continuous monitoring of these documents is essential to maintain compliance and mitigate risks associated with outdated or fraudulent information. By implementing thorough document verification and monitoring, companies can ensure the integrity of their supplier risk management program. Continuous Monitoring Continuous Monitoring refers to the ongoing, real-time oversight of supplier activities and conditions to promptly identify and address potential risks. A primary focus of continuous monitoring is assessing the financial stability of suppliers. This means regularly evaluating their financial health to detect any signs of trouble. If a supplier shows indications of financial distress, such as declining financial metrics or negative market signals, the company can take proactive measures, such as halting purchase orders, to prevent potential disruptions in the supply chain. Continuous monitoring ensures that companies can swiftly respond to changes in a supplier's status, maintaining the reliability and integrity of their supply chain operations. Critical Risk Components for Effective Supplier Risk Management There are eight different risk categories. The risk components that companies should at least address within their program. Financial Stability Financial stability is monitoring financial stability in real-time and be able to identify if there are issues whether they are getting in worse financial shape or perhaps getting in better financial shape. Digital Insurance Verification The best practice right now is what's called digital insurance verification. We're able to manage insurance coverage electronically. We don't even have to collect a certificate of insurance anymore. We can do it digitally in North America. That means that we can monitor a supplier to ensure that they continue to have the insurance requirements daily, which is a unique situation. So you want to make sure, at a minimum, you collect the certificate of insurance. If you want the best practice, you do digital insurance verification. Reputational Protection We do global adverse media monitoring. So as an example, we manage over 25,000 media sources around the globe looking for negative stories because you want to know if your supplier is caught with child labor, or if they've closed a facility somewhere in the world that you're reliant upon. So adverse media is very big at this point because things are evolving very quickly. Regulatory Compliance Regulatory compliance is basically anything that's government regulation. So, it could be the various sanctions lists. Most people don't recognize there are over 1500 watch and sanctions lists around the globe including the U.S OFAC list. That's a big one. It can be a Conflict Minerals Declaration, U.K. Modern Slavery Act, Reach ROHS, the California Transparency Act, anything that's a government regulation falls into that category. Cyber Security Cyber Security would be anything that's involved with data and document verification. It has to be able to collect and validate not only the documents such as a code of conduct, but documents with an expiration date such as an NDA or a diversity certificate. Any standardized documents should be part of the program so suppliers don't get continuously contacted for more documents. Social Responsibility Social responsibility could be anything from diversity verification, child labor, those types of things. Document Management Validate key documents such as certificates of insurance, W9 forms, and other critical documentation. This system should not only collect documents but also authenticate them, ensuring they meet the required standards and are current. Continuous monitoring of these documents is essential to maintain compliance and mitigate risks associated with outdated or fraudulent information. Health and Safety Finally, health and safety could include an HSC questionnaire, EMR ratings, or OSHA statistics. Those are eight areas that companies should at least consider looking into as far as potential risk components. Obviously, there are different parts of each, one of those where those are the broad categories. Global Supplier Risk Assessments: Reliability and Challenges Dependingon what country we're speaking of. Is the information available? Yes, there are varying degrees of information. You can get more information in North American and EMEA than you can say in APAC or South America. Is it available? Absolutely. We can do a supply risk assessment in over 120 countries. So, it is possible to get information. There is standardized information in terms of the adverse media I spoke about. The watch and sanctions list, those are all global. There's a variety of things that can be managed globally. Some of it, in terms of the financial, for instance, it depends on which country we're talking about and how much information can be obtained within that country, and secondarily, whether it can be monitored on an ongoing basis. Again, it depends on which country we're speaking about. In summary Establishing a world-class supplier risk management program involves understanding the evolution of risk management practices, addressing increasing complexities, and incorporating critical components such as financial stability, digital insurance verification, and continuous monitoring. By proactively managing supplier risk, companies can safeguard their supply chain and ensure compliance. Want to go deeper? Watch our on-demand webinar with GRMS If you would like to hear more about GRMS, watch our on-demand webinar Mitigating Supplier Risk in A Changing World." Gerard goes into greater detail on best practices and how you can proactively manage supplier risk management while staying resilient and the new normal.
Experian and Moody's Analytics have just released the Q2 2020 Main Street Report. The report brings deep insight into the overall financial well-being of the small-business landscape, as well as offer commentary on business credit trends, and what they mean for lenders and small-businesses. Small businesses have turned to borrowing to survive periods of prolonged slumping sales, in many cases from government programs offering loan forgiveness. This increased borrowing has masked rising delinquent balances, but such a solution is a short-term fix. To keep their credit current, small businesses will need to find ways to generate revenue. Defaults are expected to rise in coming quarters as forbearance programs expire and as customers are likely to change their priorities in the wake of COVID-19. In Q2, moderate delinquency, defined as 31-90 days past due, rose to 1.66 percent from 1.61 percent, marking the fourth consecutive quarter of increasing delinquency, and the first year-over-year increase since this time last year. The closure of many state and local economies in April and the first half of May left many businesses facing severe revenue shortfalls in the second quarter. This environment has resulted in businesses listing poor sales as the second most important problem facing small businesses, according to the NFIB. If you would like to get the full analysis of the data behind the latest Main Street Report, presented by leading economists from Moody's Analytics and Experian, watch the Quarterly Business Credit Review webinar.
As business delinquencies rise in response to COVID-19, credit departments are becoming increasingly challenged. In our August 13th Sip and Solve webinar, John Krickus and Andrew Moore will be on hand to share some strategies for maximizing receivables amid rising delinquencies. Managing receivables has never been more important or more challenging. Traditional approaches may no longer apply. In this 15-minute Sip and Solve session, we discuss some solutions for effectively and efficiently handling the increase in receivables many companies are facing. After watching this talk you will learn three key takeaways: Prioritizing receivable management in today's environment Analytic tools for managing receivables Flexing receivables strategies to meet your company's priorities Click to view full slides and transcripts from this session.