New Business Credit Insights on Investment, Automation, and Risk

Ask most people what’s going on in U.S. manufacturing, and you’ll get a simple story: the sector is coming back. Billions in new investment, headlines about reshoring, talk of a manufacturing renaissance. It’s a good story. It’s just not the whole story.
Experian’s latest Commercial Pulse Report digs into what’s really happening, and the picture is more layered than the headlines suggest. Yes, money is pouring into new plants and projects. But employment and output haven’t kept pace. Meanwhile, automation and AI are reshaping how manufacturers operate, and their credit behavior looks different from what you’d see in most other industries.
If you’re a commercial lender or a risk leader, that gap between “investment” and “output” is worth sitting with. Here’s what the data actually shows.
Watch The Commercial Pulse Update
How much money is being invested in manufacturing megaprojects in 2026?
The money is real. The output hasn’t caught up yet.
Start with the scale of investment. According to the Manufacturing Megaprojects Tracker there are 59 U.S. manufacturing megaprojects, worth roughly $624.7 billion and tied to about 183,000 jobs. That’s not a rounding error — that’s serious capital moving into the sector.
And it’s not just a handful of massive projects. The number of private U.S. manufacturing establishments has grown by more than 18% since 2016. More plants, more companies, more activity on paper.
But here’s the catch: none of that has shown up yet in actual output. The Industrial Production Index — which tracks real output across manufacturing, mining, and utilities — has been basically flat since 2010. Capacity utilization has drifted downward over the longer term, too. And manufacturing’s overall footprint in the economy has shrunk considerably: from roughly 21% to 25% of GDP back in the 1950s down to just 9.4% today.
So what does that tell you? Not that manufacturing is shrinking — the opposite, in terms of dollars and business formation. It tells you that a lot of this investment hasn’t turned into production yet. Whether it will, and how fast, is the open question.
How has employment in U.S. manufacturing changed in recent years?
Fewer people, more machines – employment tells a similar story to investment dollars from a people angle. Manufacturing employment peaked back in the late 1970s, when more than 19 million Americans worked in the industry. Since 2016, employment has crept up just 2.3% — even while the number of establishments jumped 18%.
Companies are opening. Investment is climbing. But headcount barely moved. Where’s the gap going?
A lot of it is automation. Research cited in the report puts the job displacement from automation at 1.7 million manufacturing positions already, with another 9.3 million U.S. jobs considered vulnerable to AI-driven automation going forward. (Worth noting: these are Tufts Index figures cited in the report, not Experian’s own projections.)
The robots back this up. Annual installations of industrial robots in the U.S. have grown 31% over the past decade, with automakers leading the pack as the biggest buyers.
Put it together and you get a sector where growth doesn’t necessarily mean more people on the floor. It means more machines doing the work, and fewer new hires needed to scale.
How is AI adoption hitting U.S. manufacturing?
Automation isn’t the only technology story here. AI adoption is accelerating too, and quickly.
According to the report, 79% of manufacturers surveyed in 2026 said they were either investing heavily in AI or actively exploring where it fits into their operations. That’s up from 64% just a year earlier. AI-driven automation and optimization also topped the list of digital transformation priorities among the manufacturers surveyed.
Part of what’s driving this is complexity. The share of manufacturers saying most of what they produce is “extremely” or “very” complex jumped from 47% in 2025 to 67% in 2026 — a big move in a single year. When your products get harder to make, the case for AI and automation gets stronger fast.
How to manufacturers utilize commercial credit compared to other industries?
Manufacturers borrow differently than everyone else. If you’re on the lending side: here’s how manufacturers actually use credit according to Experian.
Commercial cards are still the most common financial product across industries broadly. Manufacturers, though, lean more heavily on a different mix — business leases, lines of credit, and term loans show up more often in their portfolios than they do elsewhere.

Experian commercial credit data shows that manufacturing businesses use a more diversified mix of financial products than other industries, relying more heavily on leases, lines of credit and term loans.
Manufacturers also tend to open new accounts more sparingly relative to what they already have, while carrying higher credit lines on the accounts they do hold. In other words: fewer new relationships, bigger commitments within the ones that exist.
Does that different borrowing pattern translate into different risk? Not dramatically. Delinquency trends among manufacturers have tracked pretty closely with other industries. Utilization has been climbing across the board, with manufacturers running slightly hotter than average recently.
Experian’s own risk scores add a bit more texture. Over the past two years, manufacturers have posted somewhat lower Intelliscore Plus V2 scores than other industries — a sign of modestly higher delinquency risk — though that gap has been narrowing. On the flip side, Financial Stability Risk scores suggest manufacturers are actually less likely to default than businesses in other sectors.
Two different risk signals, pointing in two different directions. That’s exactly the kind of nuance a single headline number would miss.
Experian Small Business Index shows strong manufacturing credit performance
To get a sense for how manufacturing compares to other industries, the Experian Small Business Index can be a great resource. The industry view offers a national value for each industry, including only those with substantial data. Comparing the industry-level value to the national or state-level value provides insights into the comparative financial health of businesses and owners. We can see that in July, 2026 manufacturing topped the list with an index reading of 75.95.
What this all adds up to
Nobody should walk away from this data thinking manufacturing is booming or struggling — it’s doing both at once, in different ways. Investment is way up. Business formation is up. Output and employment haven’t followed at the same pace. Automation and AI are quietly doing more of the work that used to require people. And manufacturers are financing all of it through a different mix of products than most other industries use, with risk signals that cut both ways.
For commercial risk teams, that’s the real takeaway: the old shorthand — more investment means more growth means more revenue — doesn’t map cleanly onto this sector right now. Understanding how manufacturers are actually financing this transition, and how they’re performing along the way, matters more than watching the topline investment numbers alone.
The next chapter of U.S. manufacturing is still being written. The capital is already there. What happens with it — and how commercial credit supports that shift — is the part still playing out.
Learn more
- ✔ Visit our Commercial Insights Hub for in-depth reports and expert analysis.
- ✔ Subscribe to our YouTube channel for regular updates on small business trends.
- ✔ Connect with your Experian account team to explore how data-driven insights can help your business grow.
The report identifies 59 manufacturing megaprojects representing approximately $624.7 billion in investment and 183,000 jobs.
Yes. Research cited by Experian found that 79% of surveyed manufacturers were either investing heavily in AI or exploring AI opportunities in 2026, compared with 64% in 2025.
Experian data shows manufacturers use a more diversified product mix and rely more heavily on leases, lines of credit and term loans than businesses in other industries.
Related Posts
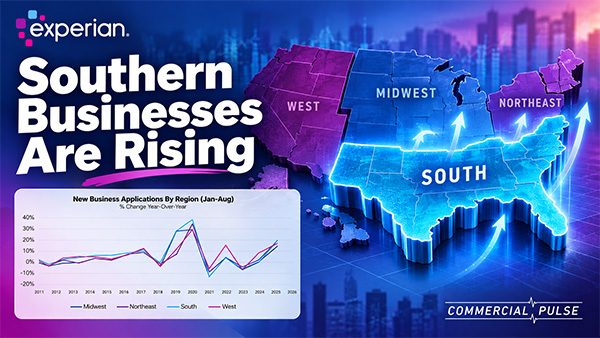
Small business formation remains one of the more notable trends in the U.S. economy. In August 532,000 new businesses launched across the country. While that was down from July, it remained well above historical averages. Since July 2020, an average of 455,000 new businesses have opened each month—56% higher than the pre-pandemic monthly average in 2018 and 2019. But the national numbers only tell part of the story. Watch The Commercial Pulse Update Experian’s latest Commercial Pulse report analysis examines where this growth is occurring and what it means for the commercial credit market. The data show that the South has emerged as an important center of small-business growth. And the businesses driving that expansion tend to have a different profile from their counterparts in other regions. For commercial lenders, understanding those differences can provide valuable context when evaluating new opportunities, credit demand and portfolio risk. Business growth is shifting geographically New business formation has increased across all U.S. regions, but the pace has not been uniform. Prior to 2018, regional differences in growth were relatively modest. During the pandemic years of 2020 and 2021, the South led the country in new business application growth. Since 2022, the West has posted the strongest growth, while the South continues to account for the greatest volume of new business openings. One factor providing context for that growth is population. The population of the South has grown more than 7% since 2019. Since 2020 alone, the region has added more than 3.6 million residents, outpacing every other U.S. region. Meanwhile, populations in other parts of the country declined between 2020 and 2022 before beginning to recover. Business formation and population movement do not necessarily have a simple cause-and-effect relationship. But their parallel growth highlights how the geographic makeup of both consumers and businesses has been changing. Credit-active businesses are growing even faster in the South The shift becomes even clearer when looking at businesses using commercial credit. Experian data shows the number of credit-active businesses in the United States has increased 55% since 2018. Every region participated in that expansion, but the South experienced the greatest growth at 70%, followed by the North at 52%, West at 50% and Midwest at 36%. The South now represents approximately 39% of U.S. credit-active businesses. It also accounted for more than 40% of newly opened commercial accounts in 2026, compared with 37% in 2019. For commercial credit organizations, that means the South represents not just a growing population of businesses, but an increasingly significant share of businesses participating in the commercial credit ecosystem. Southern businesses tend to be smaller and younger The composition of this growth is just as important as its scale. Credit-active businesses in the South and West tend to skew smaller and younger than those in the North and Midwest. In the South, 53% of businesses generate less than $500,000 in annual revenue, while 59% have fewer than five employees. Only 36% have been operating for more than 10 years, compared with 43% in the Midwest. Those characteristics can influence how businesses interact with credit. A younger business, for example, may have had less time to establish multiple commercial credit relationships. That pattern appears in Experian’s data. Across the United States, the average number of commercial credit accounts per business has declined from approximately 1.8 in 2018 to 1.5 in 2026. The South experienced the steepest decline and currently has the fewest accounts per business. At the same time, commercial credit inquiries have increased since 2023, most recently peaking in early 2026. Inquiry rates have typically been higher in the Midwest and South. The combination of fewer existing accounts and elevated inquiry activity provides useful context for lenders seeking to understand the credit needs of a growing population of younger businesses. Credit utilization tells another part of the story Regional differences also appear after businesses establish credit relationships. Businesses in the Midwest and North opening new commercial accounts tend to receive higher lines than businesses in the South and West. At the same time, businesses in the South show higher commercial card utilization despite carrying somewhat lower average balances. Experian’s analysis points to lower credit lines as an important factor behind that relationship. These trends reinforce why looking beyond a single credit metric can be important. Higher utilization, for example, can take on additional context when considered alongside credit-line size, business age, balances and regional business formation. Growth brings opportunities—and risk factors to monitor Despite significant growth and changes in business composition, regional credit performance has remained relatively steady. Commercial delinquencies across all regions are near pre-pandemic levels, while commercial credit risk scores have been relatively stable. There are regional differences worth monitoring, however. Businesses in the South have lower average commercial credit scores than businesses in the other regions analyzed, and delinquency rates tend to be higher in the North and South than in the Midwest and West. The broader takeaway is not simply that there are more small businesses in the South. It is that the composition of the commercial market is evolving alongside that growth. The South represents a growing share of credit-active businesses and new commercial accounts. Many of those businesses are younger, smaller and have fewer established commercial credit relationships. Their credit needs and behaviors may therefore differ from those of more mature businesses in other parts of the country. For commercial lenders and risk leaders, understanding those distinctions can help provide greater context around acquisition, underwriting and portfolio management decisions. As small business formation continues, Experian will continue monitoring where that growth is occurring—and how the changing business landscape is showing up in commercial credit behavior. Learn more ✔ Visit our Commercial Insights Hub for in-depth reports and expert analysis. ✔ Subscribe to our YouTube channel for regular updates on small business trends. ✔ Connect with your Experian account team to explore how data-driven insights can help your business grow. Download the Commercial Pulse Report Visit Commercial Insights Hub Where are small businesses growing in the U.S.? Experian data points to significant growth in the South. While new business formation has increased across the country, the South has consistently recorded the highest volume of new business openings and has seen the number of credit-active businesses grow 70% since 2018—compared with 55% nationally. Where are small businesses growing the most? The South has consistently had the largest volume of new business openings. The South led application growth during 2020–2021, while the West has posted the strongest growth rates since 2022. That distinction is important because it prevents the SEO headline from overstating what the data shows. Why has small business growth been so strong in the southern U.S.? The South has added more than 3.6 million residents since 2020, substantially outpacing other regions. Our report establishes a correlation rather than causation. Related Posts

Experian’s latest Commercial Pulse analysis examines these trends using retail spending data alongside Experian commercial credit data.

Explore how post-pandemic small business growth is reshaping credit risk and what CROs should watch across delinquency, utilization and portfolio trends.