
This holiday shopping season, marketers will look to take advantage of the surge in spending across channels like connected TV (CTV), programmatic, and mobile. Despite challenges such as privacy regulations and Google’s new cookie deprecation plan, this moment presents a unique opportunity for marketers to reshape their traditional approaches to consumer engagement and capitalize on these changes.
As we approach the holiday season, understanding how consumers spend, where they shop, and how their shopping habits are changing are key components to consider when crafting your holiday advertising campaigns. Our 2024 Holiday spending trends and insights report utilizes our expertise in data and insights to highlight emerging consumer behaviors and spending patterns. In our report, we share what these trends mean for marketers and how Experian can help, so you can refine your messaging and target the right audience through the best channels.
In this blog post, we cover three insights from our report. Watch our video for a recap below.
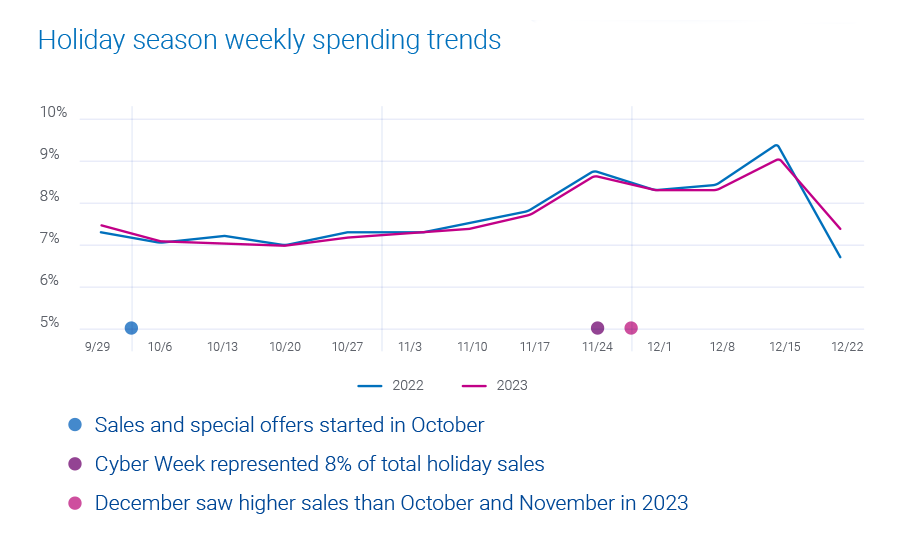
1. Consumers are shopping evenly throughout the holiday season
35% of holiday shopping was done in December, peaking at 9% of total holiday sales the week before Christmas. Cyber Week, the five-day period between Thanksgiving and Cyber Monday, and the week before Christmas brought the highest weekly sales for the past two holiday seasons.

What this means for marketers
Prepare for an extended promotional period. Schedule your marketing campaigns and sales initiatives to maximize impact during the extended season, focusing on the peaks of Cyber Week and the week before Christmas.
How Experian can help you target these shoppers
Experian’s data, ranked #1 in accuracy by Truthset, offers advertisers the ability to reach people based on demographic, geographic, and behavioral attributes (e.g. websites visited and purchase history). Our audiences are available on-the-shelf of most major platforms, making it easy for you to activate and target holiday shoppers.
We recently released 19 new holiday-focused audience segments. Here are a few you can activate:
- Black Friday Shoppers
- Cyber Monday Shoppers
- Big Box/Club Store Shoppers
- Luxury Gift Shoppers
- Discount Holiday Shoppers
- Holiday Airline Travel
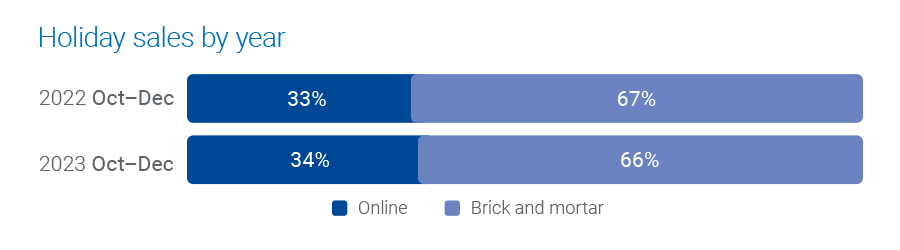
2. Online shopping is leveling out
Online holiday spending continues to remain around a third of all holiday shopping spending.
We are starting to see online shopping slow and level out – people are going back in-store. The high amount of online shopping we saw during the pandemic is starting to return to pre-pandemic behaviors.

Consumers are spending more in-store at department and discount stores but are shopping online for office/electronics/games, mass retailers, and apparel.

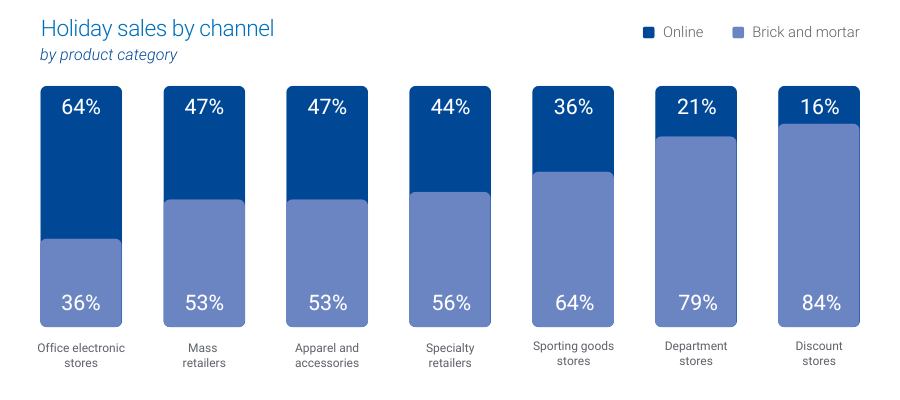
- 84% of holiday shopping was done in-store for discount stores.
- 79% of holiday shopping was done in-store for department stores.
- 64% of holiday shopping was done online for office, electronics, and games stores.
What this means for marketers
Digital and physical experiences work together. Retailers should have a multi-channel plan to reach consumers, tailoring their approach to their target audience and product and creating engaging in-store experiences to drive visitors.
How Experian can help you target and measure across channels
We connect online and offline data to enable precise targeting and measurement of marketing efforts across multiple channels. Read our case study with Cuebiq to learn how they used our Activity Feed solution to deliver in-store lift analyses to their clients.
3. CTV is the top channel to reach consumers
Over two-thirds of the U.S. population now use CTV, and the average time spent among adults is expected to surpass two hours per day in 2024. CTV offers a creative ad experience similar to its linear counterpart but provides more sophisticated targeting and analytics capabilities.
What this means for marketers
As CTV viewing continues to dominate, the importance of cross-device targeting and measurement increases.
How Experian can help you reach shoppers across devices
Later this year, we’ll add support for IPv6 in our Digital Graph as well as phone-based UID2s. This is in addition to our current coverage of IPv4 and email-based UID2s. As a result, all IP signals and UID2s will be resolved back to Experian’s household and individual profiles and their associated devices, which means marketers and platforms can better understand the full customer journey and reach people across their devices.
Download our 2025 Holiday spending trends and insights report
This holiday season is about more than just transactions – it’s about cultivating meaningful connections with your audience. Download our 2025 Holiday spending trends and insights report, in collaboration with GroundTruth, to access all of our predictions for this year’s holiday season.
When you work with Experian for your holiday shopping campaigns, you’re getting:
- Accurate consumer insights: Better understand your customers’ behavioral and demographic attributes with our #1 ranked data covering the full U.S. population.
- Signal-agnostic identity solutions: Our deep understanding of people in the offline and digital worlds provides you a persistent linkage of personally identifiable information (PII) data and digital IDs, ensuring you accurate cross-device targeting, addressability and measurement.
- Secure connectivity: Bring data and identity to life in a way that meets your needs by securely sharing data between partners, utilizing the integrations we have across the ecosystem, and using our marketing data in flexible ways.
Make the most of this holiday shopping season with Experian. Contact us today to get started.
Contact us
Latest posts
In our Ask the Expert series, we interview leaders from our partner organizations who are helping lead their brands to new heights in AdTech. Today’s interview is with Samantha Zhang, Senior Data Scientist, and Jim Meyer, General Manager of the DASH TV Universe Study at the Advertising Research Foundation (ARF). DASH is an annual tracking study conducted by the ARF to define and better understand TV audience behavior and household dynamics. What does DASH measure, and how does it help the industry understand TV consumption today? By capturing hundreds of individual- and household-level data points from each respondent in a rigorous and nationally projectable sample, DASH creates a comprehensive picture of U.S. consumer TV “infrastructure” – how America watches. Core elements in DASHElements that create context in DASHTV setsLocation | brand | smartness | service modes | sources DemographicsConnected devices Game consoles |video players | streaming devicesYesterday viewing Daypart | TV/device genre | Out-of-home viewingMobile devicesOwners | sharing usersShoppingOnline and in-store | Exposure to major RMNsInternet serviceModes | ISPs | connectivity by device Streaming audio Streaming TVSVOD/AVOD tiers and sharing | FAST Email accounts and apps Live TV Modes of access | including casting from devices Social media For example, DASH gathers: Data on every TV set, including brand, room location, age, “smartness,” and connection devices and modes Household connectivity and video service data, even in homes with no TV set Internet Service Providers (ISP) and TV service usage, including Multichannel Video Programming Distributors (MVPDs), virtual vMVPDs, streamers (ad-supported and premium), and Free Ad-Supported Television (FAST) channels Person-level ownership and usage of video-capable mobile devices, including smartphones, tablets, and laptops Measures of viewing and co-viewing across dayparts, devices, and services Additional modules covering shopping and retail media networks, streaming audio, social media, email, and apps Broad coverage and granularity make DASH a uniquely robust source of truth for practitioners across the industry, including measurement experts and ad programming strategists. DASH also reports regularly (and publicly) on key industry dynamics. DASH identified a growing segment of device-only viewers – now nearly 9 million households that watch TV, but do not own a TV set – and highlighted the implications of that trend for traditional ratings systems based only on households with TV sets. Households (HHs – million)2025 HHs (M) U.S. penetrationChange vs. 2024 (M)Total US134.8100%+2.7Connected TV (CTV)114.685%+2.1TV (Set)124.292.2%+1.1Device-only8.86.6%+1.6TV-Accessible133.198.7%+2.7 DASH called out the rise in app-based pay TV and proposed a new connection framework that better represents the modern TV world, in which linear and streaming overlap. DASH also defines the universes of households reachable with advertising. This graphic, for example, shows how all ad-supported linear and streaming properties in aggregate define the true scale of TV advertising. While 35 million households (and growing) are reachable only with streaming ads and 13 million (and falling) only with linear ads, most households are reachable with both, underscoring the importance of understanding the “overlap.” Who uses DASH data, and what decisions does it help inform? There are three primary users of DASH, each with its own use cases: Measurement providers, including Nielsen, use DASH to calibrate viewership data, turn household data into persons data (and vice versa) and estimate potential reached audiences–what the providers call media-related universe estimate (MRUEs)–for the calculation of ratings. Not surprisingly, measurement companies were the first to see the value that an independent TV universe study could provide. Media companies, including major broadcasters and streamers, use DASH to add context and color to their ad sales presentations – and to track the measurement providers, whose ratings play a major role in valuing ad inventory. AdTech companies, including Experian, use DASH to create high-value audience segments for activation. The recent accreditation of DASH by the Media Rating Council (MRC) and adoption by Nielsen as an input to its TV ratings have generated interest from a broad range of companies. We are actively pursuing new licensees and partners to make DASH more useful within, and even outside, the TV ecosystem. What does MRC accreditation signify, and why is it meaningful for DASH? MRC accreditation means DASH passed a rigorous audit conducted by Ernst & Young over many months, which validated our methodology, controls, and data quality. MRC accreditation establishes that DASH is an industry-standard dataset. While the service provider normally announces its own accreditation, the MRC took the unusual step of issuing its own release on DASH, announcing the accreditation of DASH for TV universe estimation and endorsing the study for broader, cross-media use. How does Experian use DASH data to build audiences? The segments combine specific TV usage habits and behaviors from DASH with Experian data on demographics, spending, and other contextual inputs to create a fuller view of consumer viewing behavior. They are designed to be valuable to advertisers in many categories and planning contexts – and to be customizable to fit advertisers’ media targets. The segments can be used to: Apply or suppress audiences to improve target coverage across a campaign Better align media and creative Reach elusive but high-value viewers, such as Ad Avoiders Drive valuable consumer behavior Achieve specific advertising objectives What are some practical use cases for DASH-based audiences? Here are some practical use cases for four different kinds of DASH segments in five different advertiser categories. Travel Co-WatchersA couples-only resort uses TV Co-Watching Households without Children to strengthen target reach and ad memory recallA big theme park destination uses TV Co-Watching Households with Children to reach families in moments of togetherness Home Entertainment TV Owners and Brand LoyalistsA premium TV manufacturer uses the overlap of Multi Brand TV Owners and Single Brand TV Loyalist Households to market its newest TV model to its most loyal consumers. Fast Food Screen Size ViewersA fast food chain with a high-impact new brand campaign uses Large Screen TV Viewers to better align the media and creativeThat same fast food chain uses Small-Screen TV Viewers to drive store traffic by increasing exposure of its retail campaign among on-the-go viewers Financial Services Cord Cutters A personal cost management app and a cash-back credit card target Streaming-First Cord Cutter Households to reach young, tech-savvy, cost-conscious consumers Thanks for the interview. Where can readers learn more about DASH? We started work on DASH seven years ago, and it’s been fun to watch it “grow up.” Our partnership with Experian is a big step toward putting DASH to work for advertisers and agencies. To learn more, visit our site at https://theARF.org/DASH or contact us at DASH@theARF.org. Contact us About our experts Samantha Zhang, Senior Data Scientist at ARF Samantha Zhang is a Senior Data Scientist at the Advertising Research Foundation working on the DASH TV Universe Study, with additional research spanning areas including attention measurement, digital privacy, and artificial intelligence. Jim Meyer, General Manager, DASH, at ARF Jim Meyer is general manager and co-founder of the ARF DASH TV Universe Study and managing partner of Golden Square, LLC, which advises media and research technology companies on growth strategy and development. Latest posts
Reach buyers based on how they shop in a changing market. Experian Audiences help target switchers, align to budgets, and match messaging to inventory.
Explore how Experian utilizes AI to power data-driven programmatic advertising with greater accuracy, efficiency, and consumer trust.