At A Glance
Experian’s Digital Graph and Marketing Attributes joint solution connects digital identifiers with rich consumer attributes. Our joint solution supports identity resolution, cross-channel media activation, analytics, and measurement, helping marketers unify fragmented signals and drive greater reach and insight.What is Experian’s Digital Graph and Marketing Attributes?
Experian’s Digital Graph and Marketing Attributes joint solution is a unified identity and data framework that connects digital identifiers with rich consumer attributes.
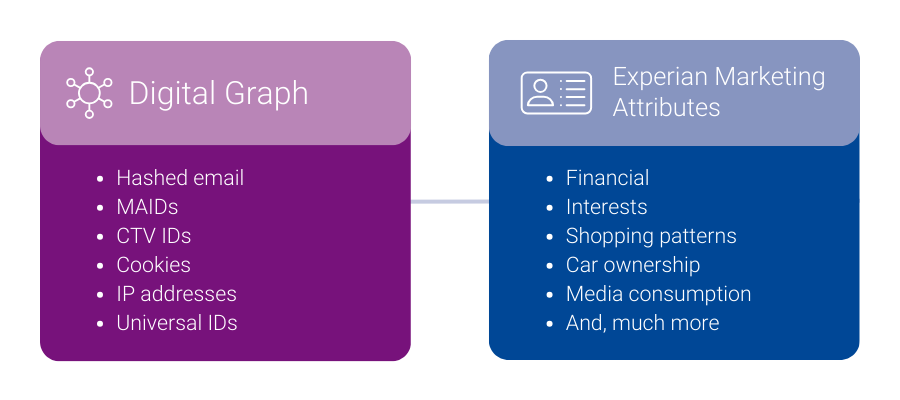
Experian’s Digital Graph connects digital identifiers to people and households, while Experian’s Marketing Attributes add depth, including demographics, interests, shopping behavior, and media preferences. Together, they help marketers and platforms with the insights and connectivity they need to understand who their customers are and reach them across digital channels.
How signal fragmentation and omnichannel are reshaping audience connection
Signal fragmentation and third-party cookie uncertainty are reshaping how our industry reaches consumers. At the same time, omnichannel media consumption spreads engagement across platforms, creating a broader but more complex view of consumer behavior. Together, these shifts are pushing marketers and platforms to rethink how they connect insights, activation, and reach across channels, opening the door to more unified approaches.
How Experian’s joint solution helps marketers and platforms address signal fragmentation and omnichannel behavior
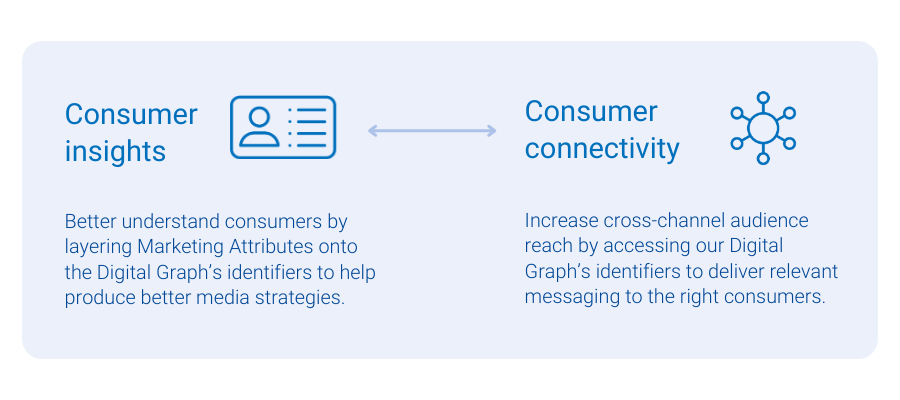
Our Digital Graph and Marketing Attributes joint solution helps marketers and platforms navigate signal fragmentation and omnichannel behavior by providing identifiers for seamless cross-channel engagement. By adding Marketing Attributes to our Digital Graph, like demographic and behavioral data, marketers and platforms can gain a better understanding of their consumers. Our joint solution uses Experian’s identity keys, the Living Unit ID (LUID) and Person ID (PID), to combine offline and digital data, giving you deeper insights into consumer behavior, greater audience reach, and improved cross-channel visibility.
What are the benefits of Experian’s Digital Graph and Marketing Attributes joint solution?
Our Digital Graph and Marketing Attributes joint solution brings identity and insight into a single framework, supporting the following benefits:
Four ways to use Digital Graph and Marketing Attributes
When our Digital Graph and Marketing Attributes come together, you get a 360-degree view of your consumers, powering four critical use cases:
How OpenX uses Experian’s Digital Graph and Marketing Attributes joint solution
OpenX is an independent omni-channel supply-side platform (SSP) focused on audience and identity-based targeting across CTV, mobile, app, and desktop environments.
OpenX licenses Experian’s Digital Graph to support one of the largest independent supply-side identity graphs. The addition of Experian Marketing Attributes enriched this graph with consumer-level insight tied to IPs, MAIDs, and client identifiers.
This approach has supported greater addressability and insight for buyers and improved monetization opportunities for publishers during ongoing signal fragmentation.
“We built on our long-term partnership with Experian to enrich our digital IDs with Experian’s Marketing Attributes, which help provide buyers better insights to audiences, thereby helping our publishers monetize their inventory. With partners like Experian, OpenX effectively facilitates the value exchange between demand and supply, ensuring our partners are able to drive results for their business in the era of signal fragmentation”
OpenXCraig Golaszewski, Sr. Director of Strategic Partnerships
How StackAdapt uses Experian’s Digital Graph and Marketing Attributes joint solution
StackAdapt is the multi-channel programmatic advertising platform used by marketers for campaign execution, insights, and measurement.
StackAdapt licenses Experian’s Digital Graph alongside Experian Audiences, which provides them with the level of information they want. Our Digital Graph supports first-party data onboarding, and Experian Audiences support segmentation for activation.
This product combination supports cross-channel reach, segmentation, and campaign measurement within the StackAdapt platform.
“StackAdapt has been recognized as the most trusted programmatic platform by marketers, and with the integration of Experian’s Digital Graph and Audiences, we are strengthening our leadership in the space. This partnership improves our ability to deliver precise cross-channel segmentation, reach, and measurement, helping advertisers run more successful campaigns. Our collaboration with Experian allows us to offer a differentiated solution in the market and ensure our clients can deliver the most precise and impactful ads to their audiences.”
StackAdaptDenis Loboda, Senior Director of Data
We recently announced a new collaboration with StackAdapt, bringing the power of Experian’s identity graph, syndicated and custom audiences directly to the StackAdapt platform.
How Experian supports cross-channel marketing strategies with our Digital Graph and Marketing Attributes joint solution
Our Digital Graph and Marketing Attributes joint solution helps marketers and platforms connect identity to insight so they can create, activate, and measure cross-channel media campaigns.
Connect with us to learn how our Digital Graph and Marketing Attributes joint solution can support your cross-channel strategy.
Get in touch with us
FAQs
Experian’s Digital Graph and Marketing Attributes joint solution supplies marketers and platforms with the insights and connectivity they need to understand who their customers are and reach them across digital channels.
Experian’s Digital Graph unifies digital identity signals into a single, privacy-safe view of households and individuals.
Experian’s Marketing Attributes are consumer-level descriptors that include demographics, interests, shopping behavior, and media usage.are consumer-level descriptors that include demographics, interests, shopping behavior, and media usage.
Experian’s Digital Graph and Marketing Attributes joint solution links digital identifiers with attribute data, allowing platforms and marketers to understand and engage audiences across channels.
Marketers, publishers, supply-side platforms, and demand-side platforms use Digital Graph and Marketing Attributes joint solution for analytics, activation, and measurement.
Experian’s Digital Graph and Marketing Attributes joint solution addresses signal fragmentation by reducing reliance on a single identifier type by supporting multiple digital identifiers within one identity framework.
Latest posts

My Experian Marketing Services’ colleagues and resident data experts Bill Tancer and Marcus Tewskbury answered the above question for marketers during our recent 2012 Holiday Planning Webinar. The webinar recapped key 2011 holiday marketing results, plus featured trends, benchmarks and recommendations for a successful and profitable 2012 holiday shopping season.
Thanks to simulcast streaming of games online and via mobile apps, die-hards are better equipped to keep track of multiple games at once. Those who stream games online live in every corner of the country, but some locales are more likely to log on for their March Madness fix than others.
I’ve had several requests to provide some numbers on finance.google.com in light of their redesign this week. Here are some quick daily stats from this week: On Wednesday 12/13/06, Google Finance ranked 16th in our Business & Finance – Business Information category with .78% market share of visits for the category up from last Wednesday’s 22nd position with .68% market share. Still the industry leader, Yahoo! Finance with 37.3% market share for the category, has over 50x the market share of Google Finance. Here’s a daily marketshare of visits chart for Google Finance: With a clearly compelling set of features and slick design, why is the gap between Google Finance and Yahoo! Finance so large? Aside for brand and switching cost issues, One possible explanation is the differences in distribution channels for the two finance sites. For 12/13/06, Google received 57% of its traffic from the Google homepage (www.google.com) primarily from search on stock ticker symbols. Yahoo! Finance in contrast received only 1.7% of its traffic from search with over 55% of its traffic coming from the Yahoo! front page and My Yahoo! pages. Contact us today