At A Glance
The Advertising Research Foundation’s DASH TV Universe Study provides a projectable view of how Americans connect to and consume TV across households, devices, and services. In this Q&A, Jim Meyer, General Manager, DASH, and Samantha Zhang, Senior Data Scientist, at the ARF explain what DASH measures, who uses it, why MRC accreditation matters, and how Experian combines DASH with its data to build audience segments for advertisers and agencies.In our Ask the Expert series, we interview leaders from our partner organizations who are helping lead their brands to new heights in AdTech. Today’s interview is with Samantha Zhang, Senior Data Scientist, and Jim Meyer, General Manager of the DASH TV Universe Study at the Advertising Research Foundation (ARF). DASH is an annual tracking study conducted by the ARF to define and better understand TV audience behavior and household dynamics.
What does DASH measure, and how does it help the industry understand TV consumption today?
By capturing hundreds of individual- and household-level data points from each respondent in a rigorous and nationally projectable sample, DASH creates a comprehensive picture of U.S. consumer TV “infrastructure” – how America watches.
| Core elements in DASH | Elements that create context in DASH |
| TV sets Location | brand | smartness | service modes | sources | Demographics |
| Connected devices Game consoles |video players | streaming devices | Yesterday viewing Daypart | TV/device genre | Out-of-home viewing |
| Mobile devices Owners | sharing users | Shopping Online and in-store | Exposure to major RMNs |
| Internet service Modes | ISPs | connectivity by device | Streaming audio |
| Streaming TV SVOD/AVOD tiers and sharing | FAST | Email accounts and apps |
| Live TV Modes of access | including casting from devices | Social media |
For example, DASH gathers:
- Data on every TV set, including brand, room location, age, “smartness,” and connection devices and modes
- Household connectivity and video service data, even in homes with no TV set
- Internet Service Providers (ISP) and TV service usage, including Multichannel Video Programming Distributors (MVPDs), virtual vMVPDs, streamers (ad-supported and premium), and Free Ad-Supported Television (FAST) channels
- Person-level ownership and usage of video-capable mobile devices, including smartphones, tablets, and laptops
- Measures of viewing and co-viewing across dayparts, devices, and services
- Additional modules covering shopping and retail media networks, streaming audio, social media, email, and apps
Broad coverage and granularity make DASH a uniquely robust source of truth for practitioners across the industry, including measurement experts and ad programming strategists. DASH also reports regularly (and publicly) on key industry dynamics. DASH identified a growing segment of device-only viewers – now nearly 9 million households that watch TV, but do not own a TV set – and highlighted the implications of that trend for traditional ratings systems based only on households with TV sets.
| Households (HHs – million) | 2025 HHs (M) | U.S. penetration | Change vs. 2024 (M) |
| Total US | 134.8 | 100% | +2.7 |
| Connected TV (CTV) | 114.6 | 85% | +2.1 |
| TV (Set) | 124.2 | 92.2% | +1.1 |
| Device-only | 8.8 | 6.6% | +1.6 |
| TV-Accessible | 133.1 | 98.7% | +2.7 |
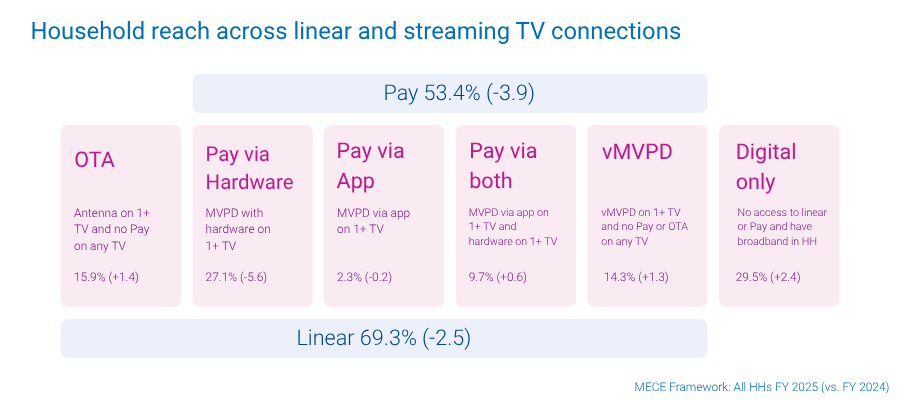
DASH called out the rise in app-based pay TV and proposed a new connection framework that better represents the modern TV world, in which linear and streaming overlap.
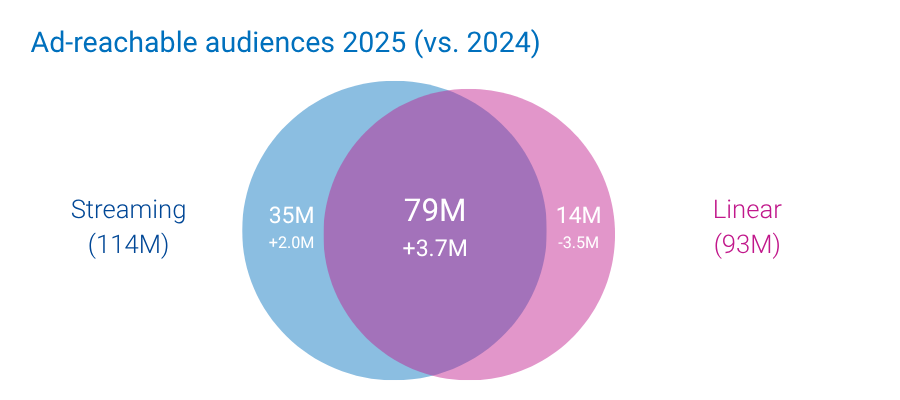
DASH also defines the universes of households reachable with advertising. This graphic, for example, shows how all ad-supported linear and streaming properties in aggregate define the true scale of TV advertising. While 35 million households (and growing) are reachable only with streaming ads and 13 million (and falling) only with linear ads, most households are reachable with both, underscoring the importance of understanding the “overlap.”
Who uses DASH data, and what decisions does it help inform?
There are three primary users of DASH, each with its own use cases:
The recent accreditation of DASH by the Media Rating Council (MRC) and adoption by Nielsen as an input to its TV ratings have generated interest from a broad range of companies. We are actively pursuing new licensees and partners to make DASH more useful within, and even outside, the TV ecosystem.
What does MRC accreditation signify, and why is it meaningful for DASH?
MRC accreditation means DASH passed a rigorous audit conducted by Ernst & Young over many months, which validated our methodology, controls, and data quality. MRC accreditation establishes that DASH is an industry-standard dataset.
While the service provider normally announces its own accreditation, the MRC took the unusual step of issuing its own release on DASH, announcing the accreditation of DASH for TV universe estimation and endorsing the study for broader, cross-media use.
How does Experian use DASH data to build audiences?
The segments combine specific TV usage habits and behaviors from DASH with Experian data on demographics, spending, and other contextual inputs to create a fuller view of consumer viewing behavior. They are designed to be valuable to advertisers in many categories and planning contexts – and to be customizable to fit advertisers’ media targets. The segments can be used to:
- Apply or suppress audiences to improve target coverage across a campaign
- Better align media and creative
- Reach elusive but high-value viewers, such as Ad Avoiders
- Drive valuable consumer behavior
- Achieve specific advertising objectives
What are some practical use cases for DASH-based audiences?
Here are some practical use cases for four different kinds of DASH segments in five different advertiser categories.
Thanks for the interview. Where can readers learn more about DASH?
We started work on DASH seven years ago, and it’s been fun to watch it “grow up.” Our partnership with Experian is a big step toward putting DASH to work for advertisers and agencies. To learn more, visit our site at https://theARF.org/DASH or contact us at DASH@theARF.org.
Contact us
About our experts

Samantha Zhang, Senior Data Scientist at ARF
Samantha Zhang is a Senior Data Scientist at the Advertising Research Foundation working on the DASH TV Universe Study, with additional research spanning areas including attention measurement, digital privacy, and artificial intelligence.

Jim Meyer, General Manager, DASH, at ARF
JimMeyer is general manager and co-founder of the ARF DASH TV Universe Study and managing partner of Golden Square, LLC, which advises media and research technology companies on growth strategy and development.
Latest posts

While the weather outside is frightfully hot this summer, it’s never too soon to start thinking about the holidays – and consumers are more likely to start their holiday shopping early this year. To get you ready for the 2022 holiday shopping season, we looked back at consumer shopping trends from 2019-2021. What did we learn and what trends do we expect to see this year? Let’s look back. A look back Over the last three years, average consumer spending has increased. Record 2021 holiday sales came amidst a wave of COVID-19 cases, rising inflation, labor shortages, and supply chain problems. Despite these challenges, consumers continued to let it snow when it came to spending during the holiday season. 2022 has been a year with its own economic roadblocks – the war in Ukraine, rising gas prices, and recession concerns. Yet 2021 was a banner year for holiday sales despite its obstacles, and we predict similar trends in the 2022 holiday shopping season. What trends do we expect to see for the most wonderful time of the year? 2022 predictions While consumer spending remains strong, changing economic conditions continue to shape shopper behavior. To develop our predictions for 2022 holiday shopper behavior, we focused on four key areas: When consumers shop Where consumers shop What consumers purchase Consumer media preferences Now, let’s make our holiday campaign planning checklist and check it twice. When consumers shop Chestnuts roasting on an open fire. Jack Frost nipping at your nose. Those aren’t the only ways to know when the holiday season has begun. Shoppers tend to spread out their holiday purchases across multiple months and were more likely to start shopping earlier. To understand holiday retail sales trends from 2019-2021, we identified four shopper segments: Early Shoppers Traditional Shoppers Late Shoppers Random Shoppers What differences did we see between our four shopper segments? Early shoppers made almost half of their holiday purchases in October Random shoppers spread out their holiday purchases evenly across multiple months Late shoppers made almost half of their holiday purchases in December Traditional shoppers made almost half of their holiday purchases in November While December continues to dominate holiday sales, October has started to gain traction over the last three years, and November remains a core shopping month. Everybody knows a turkey and a mistletoe help to make the season bright but knowing when your consumers are most likely to shop will help deck your campaign planning halls. Jingle bell rock your way to holiday sales that shine bright with our tips to prepare for earlier shoppers: Offer targeted promotions earlier in the shopping season Target your ads based on the shopping habits of your customers throughout the season Where consumers shop There’s no place like home for the holidays but most consumers aren’t shopping from home. Despite the rise in online shopping, brick and mortar locations continue to dominate holiday sales. October is the most popular month to take a one-horse open sleigh to a store, and consumers gather around the fire to online shop in November and December. With most shoppers preferring to shop in-store, and e-commerce popularity growing, it’s critical to think about bridging the gap between your online and offline presence for the consumer. Are you offering multiple paths to purchase with solutions such as BOPIS (Buy Online, Pickup In-Store)? Go down in history like Rudolph with our tips to prepare for more in-store shopping: Focus on in-store shopping experience technology (self-checkout, VR, QR codes, scan to pay, etc.) Offer multiple paths to purchase to connect your online and physical presence through methods such as BOPIS (Buy Online, Pickup In-Store), BORIS (Buy Online, Return In-Store), and ROPO (Research Online, Purchase Offline), etc. What consumers purchase When it comes to holiday gifts, for some, only a hippopotamus will do. Compared to pre-pandemic, shoppers are spending more at apparel stores and mass retailers. Spending at specialty retailers, warehouse clubs, and on office, electronic, and games is almost the same across holiday and non-holiday shopping months. Time for toys and time for cheer may be year-round, but are there any correlations between where consumers shop (online vs. in-store) and what they purchase? Our data found that shoppers who bought from mass retailers were more likely to shop online, while shopping for apparel and warehouse clubs was done at a physical store location. Put this insight to the test by thinking through how you can target your consumer based on where they shop in-store and online. You just might find that hippopotamus at a brick and mortar mass retailer location! Consumer media preferences Do you see what I see? While we are seeing a shift to digital media channel preference, consumers still engage with traditional media channels like direct mail and the traditional newspaper. Successfully connecting with your customers involves capturing their attention through the right channel. We found that our four shopping groups prefer a mix of traditional and digital media channels. What does your media channel mix look like? Hark! The herald angels sing of ways to adapt to the change in holiday spend and media preferences: Align your activation efforts to digital, but don’t forget about traditional channels Expand your targeting and activation focus beyond in-store vs. online Download our new 2025 report For a deeper dive into our predictions and actionable insights you can use to take your holiday campaign planning home for the holidays, download our new 2025 report, in collaboration with GroundTruth. Experian data can help you refine your content and creative strategy to achieve maximum ROI for each campaign across all your channels. Download now Get in touch
Hashed Email is a privacy-safe digital identifier that can further enrich and expand the functionality and utility of The Tapad Graph with access to Tapad + Experian’s universe of email data. This provides maximum coverage for targeting and measurement when combined with household and individual IDs such as Cookies, MAIDs, CTV IDs, and IP Addresses. Gain back a clearer view Recent data from DMA shows that 51% of people have held the same email address for over 10 years. Email address data by its nature is authenticated and reliable due to its longevity. When leveraging Hashed Email as an extended functionality of The Tapad Graph, we are able to link on average 5 email addresses to each individual, reaching up to 90% of households across the US. Hashed Email expands the customer view by adding new email address identifiers into The Tapad Graph that associate with traditional digital IDs and cookie-less IDs emerging in the marketplace. Reduce fragmentation; and instead of viewing the emails as multiple customers, with Hashed Email they can be viewed as one user profile. When enabled, clients who wouldn’t traditionally have access to first-party customer emails are able to associate and link privacy-safe emails to individuals and their households. Brands and retailers can use Hashed Email to extend these linkages across offline purchases associated with each email; connecting traditional digital identifiers between walled gardens, activation in programmatic media buys, and addressable TV. With the holiday season quickly approaching, access to Hashed Emails will instantly increase scale, connectivity and improve measurement when efficiency, personalization and holistic attribution are pivotal to marketing strategies. Let’s visualize how quickly the customer journey can become fragmented when email addresses that belong to the same person are not associated. Mary has 3 email addresses that she frequently uses. One for social media accounts Email ID 1, one for shopping accounts Email ID 2, and another for work Email ID 3. Mary is a brand loyalist to a top national retailer and whenever there is a new season, there is a high likelihood that she will purchase the latest seasonal decor from that store. She recently did some holiday shopping in-store where she purchased nearly the whole holiday line. Email ID 2 was used to send her a receipt. However, Mary annoyingly receives the store’s ads on Facebook for holiday decor that she had already purchased. This is because the retailer has not yet identified that Email ID 1 and Email ID 2 belong to the same consumer. If the retailer were to leverage Hashed Email, they would be able to identify that both email addresses used belong to Mary. This association connects her multiple email addresses together, enables her offline purchases to sync with her online activity, and helps to determine the most accurate ROAS. Hashed Email is a cookie-free added view into consumer behavior for control over messaging and for measurement. When leveraging it’s possible to report back across all channels and devices in a universal format to know when and how conversions are taking place. Don’t leave valuable data on the table Hashed Email has use cases beyond reducing wasted media impressions. Hashed Email’s full capabilities extend to campaign measurement and attribution modeling. When utilizing The Tapad Graph combined with Hashed Email, know from the first touchpoint to the last where your customers are engaging. But more importantly, know where households and the individuals inside of those households are converting across all of their digital devices, by using traditional digital IDs, cookie-less IDs, and Hashed Email to associate, measure, and correlate online and offline purchases. Imagine what your campaigns could look like this holiday season if you expanded your graph with up to 5 additional IDs per household. This impact could be a game-changer to scale this holiday season. Hashed Email is a reliable cookie-less digital identifier that expands your customer universe that connects online and offline activity while improving the customer experience and reducing wasted media spend. Enabling Hashed Email for the holiday season is not an opportunity that should be passed on. Where do you sign up, you ask? Get in touch
Identified in The 2021 Digital Advertising Trends Report published by Postclick, marketers are striving to improve and enhance their segmentation and targeting strategies in their digital ad campaigns. Carlos Lopez, SVP of Brand Planning at Digitas Health predicted that in 2021, the challenge will be to overcome the death of third-party cookies and still deliver a personalized advertising experience. It’s fair to say that his prediction will still be impacting marketers past 2021 with the delay of cookie deprecation. These goals along with the constantly changing digital landscape paint a challenging picture for even the most advanced marketers. Marketers can be prepared for the next era of digital marketing by finding the right mix of partners that offer privacy-safe, cookie-free solutions. Smart marketers will employ these solutions and compare these results with data from cookies. The Tapad + Experian Take The Tapad Graph enables brands, agencies, and ad tech platforms to identify and target individuals and households across their digital touchpoints. With this data, they can personalize messages across devices, measure and optimize throughout the customer journey, and then report back on conversions at the individual and household levels. Tapad, now part of Experian, leverages a machine learning algorithm that determines these connections at scale by using probabilistic models with authenticated, privacy-safe, real-time data. There are a myriad of cookieless IDs emerging in the marketplace, and it’s not likely going to be a one size fits all situation. In order to be prepared for the next era of digital marketing, marketers should diversify ID partners and be proactive with testing while the cookie is still around to benchmark against. With Switchboard, a module within The Tapad Graph, we’ve been able to develop connections between traditional digital identifiers (IP Addresses, MAIDs, CTV IDs) and the new wave of cookieless IDs (UID2.0, Panorama ID, ID5 ID) that will be utilized in the future. Here’s an example of what The Tapad Graph and Switchboard looks like at the Household level with various traditional digital identifiers and cookieless IDs. Get in touch