What the Energy Transition Means for Small Business Risk, Cost, and Credit Strategy

A structural shift is underway in the U.S. economy—one that is easy to underestimate but increasingly difficult to ignore. Power demand is accelerating at a pace not seen in decades, driven largely by the rapid expansion of AI and data infrastructure. For lenders and risk professionals, this isn’t just an energy story—it’s a credit, cost, and portfolio strategy story.
As highlighted in Experian’s latest Commercial Pulse Report (04.21.2026), electricity demand is entering a new phase of sustained growth. Unlike previous cycles, this surge is not temporary—it is structural, capital-intensive, and poised to reshape the operating environment for small businesses over the long term.
Watch the Commercial Pulse Update
The New Demand Curve: AI as an Energy Catalyst
The rise of AI is often framed in terms of productivity and innovation. Less discussed is its physical footprint—specifically, the energy required to power it.
Data centers, the backbone of AI infrastructure, are expected to consume more than 600 terawatt-hours of electricity annually by 2030, accounting for over 11% of total U.S. power demand. This represents a dramatic increase in a relatively short period of time.
At the same time, overall electricity demand has already been trending upward. In 2025, U.S. electricity consumption was approximately 11% higher than in 2020, reflecting not just AI growth but broader digitalization across industries.
For small businesses, the implication is straightforward: energy is no longer a stable, background operating expense—it is becoming a dynamic and increasingly material cost driver.
Supply Constraints and the Cost Transmission Effect
While demand is accelerating, supply is struggling to keep pace. The energy sector is undergoing a transition away from traditional fossil fuels toward renewable sources such as wind and solar. While renewables offer faster development timelines, they require significant upfront investment and infrastructure upgrades to scale effectively.
From 2015 through 2024, U.S. utilities invested approximately $1.3 trillion in capital expenditures, with another $1.1 trillion projected through 2029. These investments are critical—but they are not without cost.
Utilities typically recover infrastructure investments through rate increases. As a result, rising capital expenditures are translating directly into higher electricity prices for both consumers and businesses. Since 2021, electricity rates have increased steadily, reflecting the widening gap between demand growth and supply expansion.
For small businesses, this creates a cost-transmission effect: large-scale infrastructure investment at the utility level flows downstream into operating expenses, compressing margins—particularly for energy-intensive industries.
A More Capital-Intensive Sector—and Why That Matters for Credit
From a credit perspective, the electric energy sector presents a distinct and increasingly important profile.
Experian data shows that businesses within the sector are significantly more capital-intensive than the broader market. Average commercial balances per business are roughly four times the cross-industry average, reflecting the scale of investment required to build and maintain energy infrastructure.
Financing structures also differ. The sector relies more heavily on term loans and leases—products aligned with long-duration, asset-heavy investments—than on revolving credit, which is typically used for working capital.
At the same time, demand for credit in the sector has been rising. Credit-active businesses have grown faster than the broader market, and inquiry activity has accelerated, particularly over the past two years.
For lenders, this signals two key dynamics:
- Sustained demand for structured financing products tied to infrastructure and equipment
- Increased exposure to a sector with elevated capital requirements but improving fundamentals
Improving Credit Quality Amid Higher Leverage
One of the more notable trends is that credit quality within the energy sector has improved, even as borrowing remains elevated.
Severe delinquency rates—accounts 90+ days past due—have declined materially and now sit well below the broader market. This suggests that, despite higher leverage and utilization, businesses in the sector are managing their obligations effectively.
This divergence is important. While many sectors have faced rising credit pressure in recent years, the energy sector appears to be strengthening, supported by consistent demand and long-term investment flows.
For risk teams, this creates a more nuanced view of exposure. Higher balances do not necessarily equate to higher risk—particularly in sectors where revenue visibility and demand fundamentals are strong.
The Small Business Impact: Margin Pressure Meets Strategic Adjustment
For small businesses outside the energy sector, the implications are less about opportunity and more about adaptation.
Rising electricity costs are likely to become a persistent headwind. Unlike one-time shocks, this pressure is tied to long-term structural changes in demand and infrastructure investment. As a result, businesses may need to rethink how they manage energy as part of their broader financial strategy.
Key considerations include:
- Pricing strategy: Passing through higher costs where possible without eroding demand
- Expense management: Identifying efficiencies to offset rising utility expenses
- Capital planning: Evaluating investments in energy efficiency or alternative solutions
- Liquidity management: Ensuring sufficient flexibility to absorb cost volatility
For lenders, these dynamics will increasingly show up in credit performance—not necessarily as immediate distress, but as gradual margin compression that can impact repayment capacity over time.
Why This Matters Now
The most important takeaway is that this is not a short-term cycle. The convergence of AI growth, infrastructure investment, and energy transition is creating a durable shift in both cost structures and credit demand.
Energy is becoming a strategic variable—one that influences everything from operating margins to borrowing needs.
For CROs and risk leaders, this reinforces the importance of:
- Monitoring sector-specific cost pressures
- Incorporating energy exposure into risk models
- Understanding capital intensity differences across industries
- Leveraging data-driven insights to identify emerging opportunities and risks
The energy sector itself may present attractive lending opportunities, given its strong demand outlook and improving credit profile. At the same time, rising energy costs will act as a secondary pressure across portfolios, particularly among small and mid-sized businesses.
Final Thought
Power demand is no longer just an infrastructure story—it’s a credit story.
As AI continues to scale and the energy transition accelerates, the effects will ripple across industries, balance sheets, and lending strategies. Those who understand these dynamics early will be better positioned to manage risk, identify opportunity, and support small businesses navigating an increasingly complex cost environment.
Learn more
- ✔ Visit our Commercial Insights Hub for in-depth reports and expert analysis.
- ✔ Subscribe to our YouTube channel for regular updates on small business trends.
- ✔ Connect with your Experian account team to explore how data-driven insights can help your business grow.
Related Posts
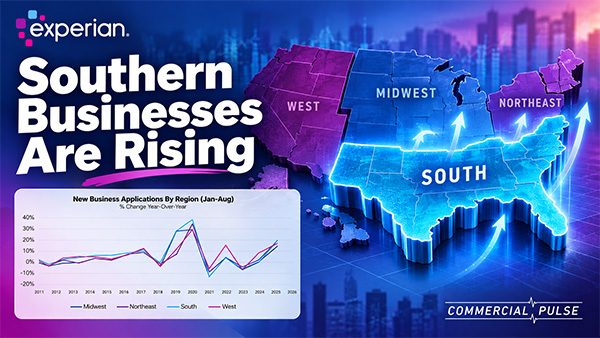
Small business formation remains one of the more notable trends in the U.S. economy. In August 532,000 new businesses launched across the country. While that was down from July, it remained well above historical averages. Since July 2020, an average of 455,000 new businesses have opened each month—56% higher than the pre-pandemic monthly average in 2018 and 2019. But the national numbers only tell part of the story. Watch The Commercial Pulse Update Experian’s latest Commercial Pulse report analysis examines where this growth is occurring and what it means for the commercial credit market. The data show that the South has emerged as an important center of small-business growth. And the businesses driving that expansion tend to have a different profile from their counterparts in other regions. For commercial lenders, understanding those differences can provide valuable context when evaluating new opportunities, credit demand and portfolio risk. Business growth is shifting geographically New business formation has increased across all U.S. regions, but the pace has not been uniform. Prior to 2018, regional differences in growth were relatively modest. During the pandemic years of 2020 and 2021, the South led the country in new business application growth. Since 2022, the West has posted the strongest growth, while the South continues to account for the greatest volume of new business openings. One factor providing context for that growth is population. The population of the South has grown more than 7% since 2019. Since 2020 alone, the region has added more than 3.6 million residents, outpacing every other U.S. region. Meanwhile, populations in other parts of the country declined between 2020 and 2022 before beginning to recover. Business formation and population movement do not necessarily have a simple cause-and-effect relationship. But their parallel growth highlights how the geographic makeup of both consumers and businesses has been changing. Credit-active businesses are growing even faster in the South The shift becomes even clearer when looking at businesses using commercial credit. Experian data shows the number of credit-active businesses in the United States has increased 55% since 2018. Every region participated in that expansion, but the South experienced the greatest growth at 70%, followed by the North at 52%, West at 50% and Midwest at 36%. The South now represents approximately 39% of U.S. credit-active businesses. It also accounted for more than 40% of newly opened commercial accounts in 2026, compared with 37% in 2019. For commercial credit organizations, that means the South represents not just a growing population of businesses, but an increasingly significant share of businesses participating in the commercial credit ecosystem. Southern businesses tend to be smaller and younger The composition of this growth is just as important as its scale. Credit-active businesses in the South and West tend to skew smaller and younger than those in the North and Midwest. In the South, 53% of businesses generate less than $500,000 in annual revenue, while 59% have fewer than five employees. Only 36% have been operating for more than 10 years, compared with 43% in the Midwest. Those characteristics can influence how businesses interact with credit. A younger business, for example, may have had less time to establish multiple commercial credit relationships. That pattern appears in Experian’s data. Across the United States, the average number of commercial credit accounts per business has declined from approximately 1.8 in 2018 to 1.5 in 2026. The South experienced the steepest decline and currently has the fewest accounts per business. At the same time, commercial credit inquiries have increased since 2023, most recently peaking in early 2026. Inquiry rates have typically been higher in the Midwest and South. The combination of fewer existing accounts and elevated inquiry activity provides useful context for lenders seeking to understand the credit needs of a growing population of younger businesses. Credit utilization tells another part of the story Regional differences also appear after businesses establish credit relationships. Businesses in the Midwest and North opening new commercial accounts tend to receive higher lines than businesses in the South and West. At the same time, businesses in the South show higher commercial card utilization despite carrying somewhat lower average balances. Experian’s analysis points to lower credit lines as an important factor behind that relationship. These trends reinforce why looking beyond a single credit metric can be important. Higher utilization, for example, can take on additional context when considered alongside credit-line size, business age, balances and regional business formation. Growth brings opportunities—and risk factors to monitor Despite significant growth and changes in business composition, regional credit performance has remained relatively steady. Commercial delinquencies across all regions are near pre-pandemic levels, while commercial credit risk scores have been relatively stable. There are regional differences worth monitoring, however. Businesses in the South have lower average commercial credit scores than businesses in the other regions analyzed, and delinquency rates tend to be higher in the North and South than in the Midwest and West. The broader takeaway is not simply that there are more small businesses in the South. It is that the composition of the commercial market is evolving alongside that growth. The South represents a growing share of credit-active businesses and new commercial accounts. Many of those businesses are younger, smaller and have fewer established commercial credit relationships. Their credit needs and behaviors may therefore differ from those of more mature businesses in other parts of the country. For commercial lenders and risk leaders, understanding those distinctions can help provide greater context around acquisition, underwriting and portfolio management decisions. As small business formation continues, Experian will continue monitoring where that growth is occurring—and how the changing business landscape is showing up in commercial credit behavior. Learn more ✔ Visit our Commercial Insights Hub for in-depth reports and expert analysis. ✔ Subscribe to our YouTube channel for regular updates on small business trends. ✔ Connect with your Experian account team to explore how data-driven insights can help your business grow. Download the Commercial Pulse Report Visit Commercial Insights Hub Where are small businesses growing in the U.S.? Experian data points to significant growth in the South. While new business formation has increased across the country, the South has consistently recorded the highest volume of new business openings and has seen the number of credit-active businesses grow 70% since 2018—compared with 55% nationally. Where are small businesses growing the most? The South has consistently had the largest volume of new business openings. The South led application growth during 2020–2021, while the West has posted the strongest growth rates since 2022. That distinction is important because it prevents the SEO headline from overstating what the data shows. Why has small business growth been so strong in the southern U.S.? The South has added more than 3.6 million residents since 2020, substantially outpacing other regions. Our report establishes a correlation rather than causation. Related Posts

Explore Experian insights on U.S. manufacturing investment, AI and automation adoption, employment trends, and commercial credit performance.

Experian’s latest Commercial Pulse analysis examines these trends using retail spending data alongside Experian commercial credit data.