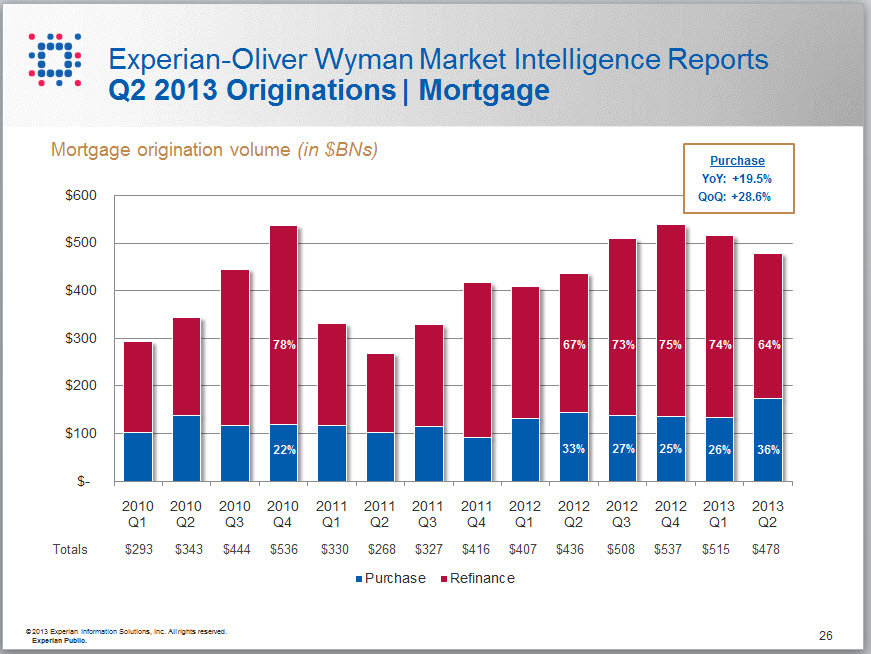
An analysis of trends shows that mortgage originations have increased by 10 percent from a year ago. More important, a look at the most recent completed quarter shows a 29 percent increase in home purchases from the prior quarter and a decrease in the number of refinances, suggesting a sustained recovery is beginning to come from purchases. These findings and others were part of the quarterly analysis from Experian that examines real-estate trends.
The key statistic in the real-estate market is the change in the ratios of refinances versus home purchases, with purchases making up a much greater proportion of the total origination volume. The data from Experian’s IntelliView product indicates that despite a 7 percent decrease from the previous quarter in refinancing activity, home purchases grew by 20 percent year over year and 29 percent quarter over quarter, and this is where we can begin to see some of the real-estate recovery taking place.”
The analysis of existing and new home sales also points to the turnaround in the real-estate market. The data shows a reduction in sales of distressed homes and an increase in conventional sales. Since last year, the sales of distressed properties from short sales and foreclosures have been reduced from 25 percent to just 15 percent, while conventional existing home sales grew by 32 percent year over year, nearly double the overall growth rate of existing home sales. Combine this with strong growth year over year from new home sales at 38 percent, and it is easy to see that the recovery could be coming from purchases.
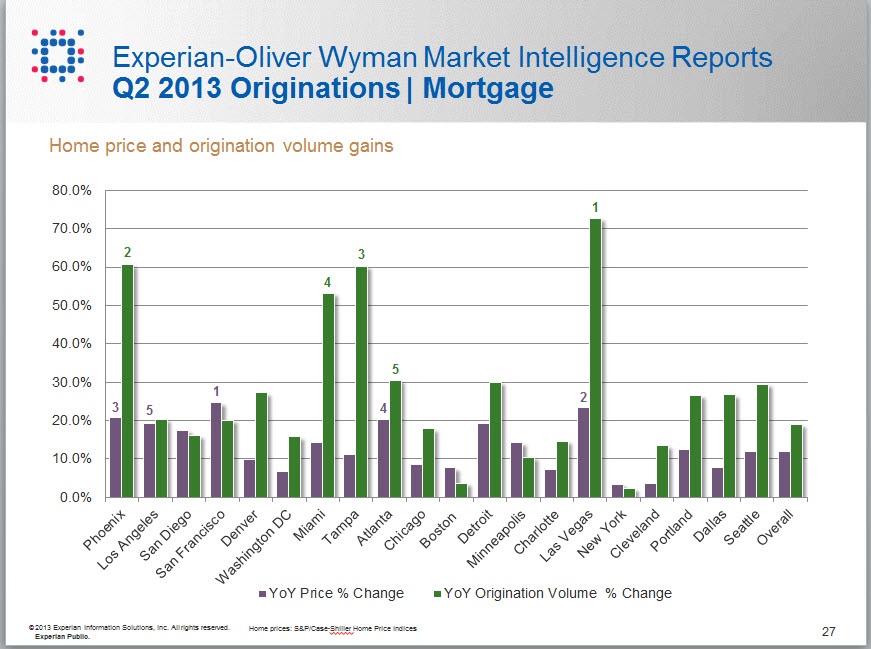
Looking at the top metropolitan areas in terms of price appreciation and origination volume, Las Vegas, Nev.; Phoenix, Ariz.; and Atlanta, Ga., were three cities ranked in the top five for both categories. They were followed by Miami and Tampa, Fla., both in the top five for originations but not for prices, even though they had respectable double-digit price percentage increases. San Francisco and Los Angeles, Calif., also saw top-five price gains, but they were not in the top five for originations, despite their strong performance. This indicates that the areas showing the greatest recovery are those that were hardest hit during the downturn, such as Florida, Nevada, Arizona and California.
Further evidence of the improving real-estate market is the significant jump in home-equity lines of credit (HELOC) in the second quarter of FY 2013 — the first major jump of this kind since the recession. Growing slowly but consistently since 2010, it increased about 10 percent last year but exploded this quarter with a more than 30 percent increase in the quarter and year over year. This data demonstrates an improved position for many consumers who now have equity in their homes due to market price increases.
We continue to see a very conservative lending approach, with nearly 90 percent of HELOCs still coming from super-prime and prime consumers. However, there is an opportunity for more people to actually participate in getting a home-equity line because of home price improvements. This trend is likely to continue as we see more homeowners move into a better equity position.
The West, Midwest, South Central, South Atlantic and Northeast regions of the United States all have shown strong year-over-year growth in HELOCs, with the West being the standout among the group. This is attributed to the price appreciation coming from cities like San Francisco, Los Angeles, Phoenix and Las Vegas. The Northeast also consistently leads in HELOCs nationwide regardless of how the real-estate market is performing in that area of the country.
A look at mortgage delinquencies is the final piece of the data puzzle supporting a real-estate recovery. In this area, Experian® continues to see a downward trend across all the different time segments. The analysis showed that short-term delinquencies — 30 to 59 days past due (DPD) — dropped to 1.51 percent for the quarter and have been less than 2 percent for more than a year and a half. Midrange delinquencies — 60 to 89 DPD — saw a very slight 1 percent increase for the quarter, but they have been less than 1 percent for more than a year and a half as well. Long-term delinquencies — 90 to 180 DPD — were down 1.32 percent for the quarter. This impressive downward trend is the result of bad loans from the first real-estate bubble being removed and replaced with postrecession conservative lending.
The data for this insight and analysis was provided by Experian’s IntelliViewSM product. IntelliView data is sourced from the information that supports the Experian–Oliver Wyman Market Intelligence Reports and is easily accessed through an intuitive, online graphical user interface, which enables financial professionals to extract key findings from the data and integrate them into their business strategies. This unique data asset does this by delivering market intelligence on consumer credit behavior within specific lending categories and geographic regions.